
Page 96 - Introduction to Paleobiology and The Fossil Record
P. 96
PALEOECOLOGY AND PALEOCLIMATES 83
ulations of species living in association – there
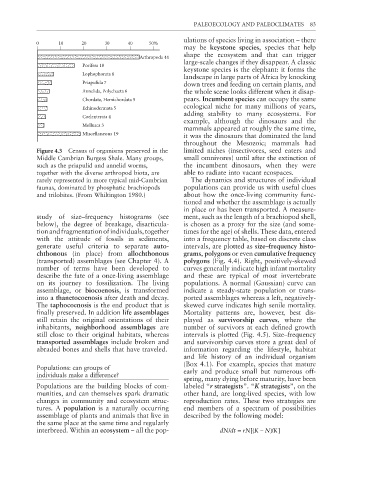
0 10 20 30 40 50%
may be keystone species, species that help
shape the ecosystem and that can trigger
Arthropoda 44
large-scale changes if they disappear. A classic
Porifera 18
keystone species is the elephant: it forms the
Lophophorata 8
landscape in large parts of Africa by knocking
Priapulida 7 down trees and feeding on certain plants, and
Annelida, Polychaeta 6 the whole scene looks different when it disap-
Chordata, Hemichordata 5 pears. Incumbent species can occupy the same
ecological niche for many millions of years,
Echinodermata 5
adding stability to many ecosystems. For
Coelenterata 4
example, although the dinosaurs and the
Mollusca 3
mammals appeared at roughly the same time,
Miscellaneous 19
it was the dinosaurs that dominated the land
throughout the Mesozoic; mammals had
Figure 4.3 Census of organisms preserved in the limited niches (insectivores, seed eaters and
Middle Cambrian Burgess Shale. Many groups, small omnivores) until after the extinction of
such as the priapulid and annelid worms, the incumbent dinosaurs, when they were
together with the diverse arthropod biota, are able to radiate into vacant ecospaces.
rarely represented in more typical mid-Cambrian The dynamics and structures of individual
faunas, dominated by phosphatic brachiopods populations can provide us with useful clues
and trilobites. (From Whiltington 1980.) about how the once-living community func-
tioned and whether the assemblage is actually
in place or has been transported. A measure-
study of size–frequency histograms (see ment, such as the length of a brachiopod shell,
below), the degree of breakage, disarticula- is chosen as a proxy for the size (and some-
tion and fragmentation of individuals, together times for the age) of shells. These data, entered
with the attitude of fossils in sediments, into a frequency table, based on discrete class
generate useful criteria to separate auto- intervals, are plotted as size–frequency histo-
chthonous (in place) from allochthonous grams, polygons or even cumulative frequency
(transported) assemblages (see Chapter 4). A polygons (Fig. 4.4). Right, positively-skewed
number of terms have been developed to curves generally indicate high infant mortality
describe the fate of a once-living assemblage and these are typical of most invertebrate
on its journey to fossilization. The living populations. A normal (Gaussian) curve can
assemblage, or biocoenosis, is transformed indicate a steady-state population or trans-
into a thanetocoenosis after death and decay. ported assemblages whereas a left, negatively-
The taphocoenosis is the end product that is skewed curve indicates high senile mortality.
finally preserved. In addition life assemblages Mortality patterns are, however, best dis-
still retain the original orientations of their played as survivorship curves, where the
inhabitants, neighborhood assemblages are number of survivors at each defi ned growth
still close to their original habitats, whereas intervals is plotted (Fig. 4.5). Size–frequency
transported assemblages include broken and and survivorship curves store a great deal of
abraded bones and shells that have traveled. information regarding the lifestyle, habitat
and life history of an individual organism
(Box 4.1). For example, species that mature
Populations: can groups of early and produce small but numerous off-
individuals make a difference?
spring, many dying before maturity, have been
Populations are the building blocks of com- labeled “r strategists”. “K strategists”, on the
munities, and can themselves spark dramatic other hand, are long-lived species, with low
changes in community and ecosystem struc- reproduction rates. These two strategies are
tures. A population is a naturally occurring end members of a spectrum of possibilities
assemblage of plants and animals that live in described by the following model:
the same place at the same time and regularly
interbreed. Within an ecosystem – all the pop- dN dt = rN K − N K]
)
/
(
/
[