
Page 97 - Introduction to Paleobiology and The Fossil Record
P. 97
84 INTRODUCTION TO PALEOBIOLOGY AND THE FOSSIL RECORD
Frequency Frequency Frequency
Size of individuals (age units) Size of individuals (age units) Size of individuals (age units)
(a) (b) (c)
Frequency Frequency
Size of individuals (age units) Size of individuals (age units)
(d) (e)
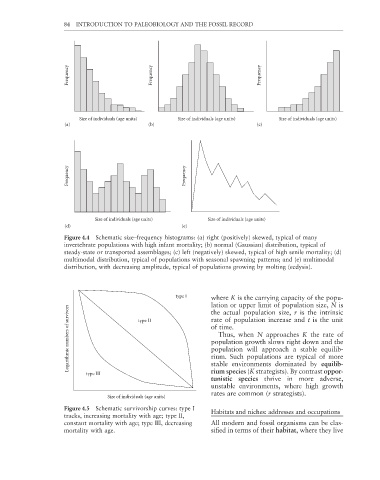
Figure 4.4 Schematic size–frequency histograms: (a) right (positively) skewed, typical of many
invertebrate populations with high infant mortality; (b) normal (Gaussian) distribution, typical of
steady-state or transported assemblages; (c) left (negatively) skewed, typical of high senile mortality; (d)
multimodal distribution, typical of populations with seasonal spawning patterns; and (e) multimodal
distribution, with decreasing amplitude, typical of populations growing by molting (ecdysis).
type I where K is the carrying capacity of the popu-
lation or upper limit of population size, N is
Logarithmic numbers of survivors of time.
the actual population size, r is the intrinsic
rate of population increase and t is the unit
type ΙΙ
Thus, when N approaches K the rate of
population growth slows right down and the
population will approach a stable equilib-
stable environments dominated by equilib-
rium species (K strategists). By contrast oppor-
type ΙΙΙ rium. Such populations are typical of more
tunistic species thrive in more adverse,
unstable environments, where high growth
rates are common (r strategists).
Size of individuals (age units)
Figure 4.5 Schematic survivorship curves: type I Habitats and niches: addresses and occupations
tracks, increasing mortality with age; type II,
constant mortality with age; type III, decreasing All modern and fossil organisms can be clas-
mortality with age. sified in terms of their habitat, where they live