
Page 192 - Introduction to Petroleum Engineering
P. 192
RESERVOIR CHARACTERIZATION ISSUES 179
(a) (b)
Well 3
GR log
Clean sand Well 1
GR log
Well 3
Well 1 GR log
GR log
Well 2
GR log Well 2
GR log
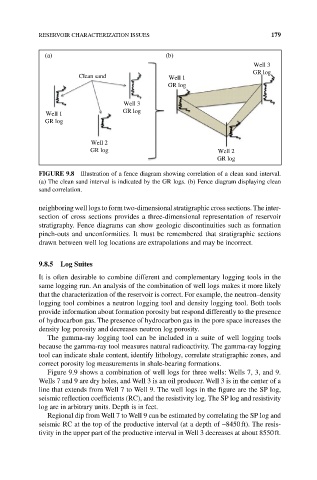
FIGuRE 9.8 Illustration of a fence diagram showing correlation of a clean sand interval.
(a) The clean sand interval is indicated by the GR logs. (b) Fence diagram displaying clean
sand correlation.
neighboring well logs to form two‐dimensional stratigraphic cross sections. The inter-
section of cross sections provides a three‐dimensional representation of reservoir
stratigraphy. Fence diagrams can show geologic discontinuities such as formation
pinch‐outs and unconformities. It must be remembered that stratigraphic sections
drawn between well log locations are extrapolations and may be incorrect.
9.8.5 Log Suites
It is often desirable to combine different and complementary logging tools in the
same logging run. An analysis of the combination of well logs makes it more likely
that the characterization of the reservoir is correct. For example, the neutron–density
logging tool combines a neutron logging tool and density logging tool. Both tools
provide information about formation porosity but respond differently to the presence
of hydrocarbon gas. The presence of hydrocarbon gas in the pore space increases the
density log porosity and decreases neutron log porosity.
The gamma‐ray logging tool can be included in a suite of well logging tools
because the gamma‐ray tool measures natural radioactivity. The gamma‐ray logging
tool can indicate shale content, identify lithology, correlate stratigraphic zones, and
correct porosity log measurements in shale‐bearing formations.
Figure 9.9 shows a combination of well logs for three wells: Wells 7, 3, and 9.
Wells 7 and 9 are dry holes, and Well 3 is an oil producer. Well 3 is in the center of a
line that extends from Well 7 to Well 9. The well logs in the figure are the SP log,
seismic reflection coefficients (RC), and the resistivity log. The SP log and resistivity
log are in arbitrary units. Depth is in feet.
Regional dip from Well 7 to Well 9 can be estimated by correlating the SP log and
seismic RC at the top of the productive interval (at a depth of ~8450 ft). The resis-
tivity in the upper part of the productive interval in Well 3 decreases at about 8550 ft.