
Page 193 - Introduction to Petroleum Engineering
P. 193
180 WELL LOGGING
Well 7 Well 3 Well 9
8400
Top of formation
8450 Well 7 - SP
Well 7 - RC
Well 7 - Res.
Well 3 - SP
Depth 8500 Well 3 - RC
Well 3 - Res.
Well 9 - SP
Well 9 - RC
WOC
8550 Well 9 - Res.
SP = Spontaneous potential
RC = Seismic reflection coefficient
Res. = Resistivity
8600
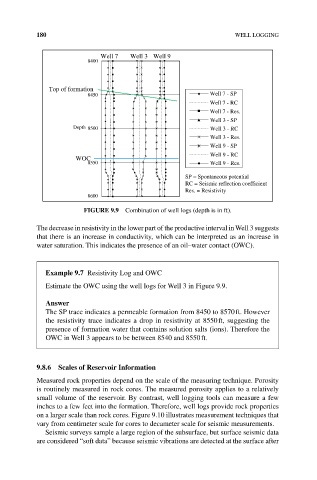
FIGuRE 9.9 Combination of well logs (depth is in ft).
The decrease in resistivity in the lower part of the productive interval in Well 3 suggests
that there is an increase in conductivity, which can be interpreted as an increase in
water saturation. This indicates the presence of an oil–water contact (OWC).
Example 9.7 Resistivity Log and OWC
Estimate the OWC using the well logs for Well 3 in Figure 9.9.
answer
The SP trace indicates a permeable formation from 8450 to 8570 ft. However
the resistivity trace indicates a drop in resistivity at 8550 ft, suggesting the
presence of formation water that contains solution salts (ions). Therefore the
OWC in Well 3 appears to be between 8540 and 8550 ft.
9.8.6 Scales of Reservoir Information
Measured rock properties depend on the scale of the measuring technique. Porosity
is routinely measured in rock cores. The measured porosity applies to a relatively
small volume of the reservoir. By contrast, well logging tools can measure a few
inches to a few feet into the formation. Therefore, well logs provide rock properties
on a larger scale than rock cores. Figure 9.10 illustrates measurement techniques that
vary from centimeter scale for cores to decameter scale for seismic measurements.
Seismic surveys sample a large region of the subsurface, but surface seismic data
are considered “soft data” because seismic vibrations are detected at the surface after