
Page 277 - Introduction to Petroleum Engineering
P. 277
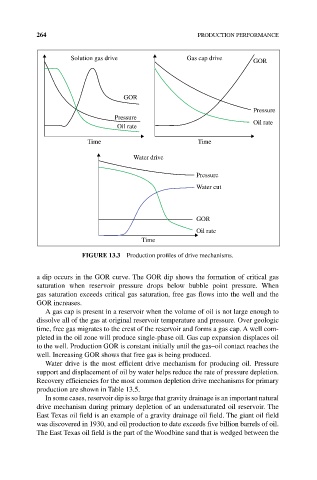
264                                          PRODUCTION PERFORMANCE

                     Solution gas drive              Gas cap drive     GOR


                                   GOR
                                                                       Pressure
                                 Pressure
                                  Oil rate                             Oil rate

                         Time                           Time

                                      Water drive

                                                        Pressure
                                                        Water cut


                                                        GOR
                                                        Oil rate
                                        Time

                        FIgURE 13.3  Production profiles of drive mechanisms.

           a dip occurs in the GOR curve. The GOR dip shows the formation of critical gas
             saturation when reservoir pressure drops below bubble point pressure.  When
           gas  saturation exceeds critical gas saturation, free gas flows into the well and the
           GOR increases.
              A gas cap is present in a reservoir when the volume of oil is not large enough to
           dissolve all of the gas at original reservoir temperature and pressure. Over geologic
           time, free gas migrates to the crest of the reservoir and forms a gas cap. A well com-
           pleted in the oil zone will produce single‐phase oil. Gas cap expansion displaces oil
           to the well. Production GOR is constant initially until the gas–oil contact reaches the
           well. Increasing GOR shows that free gas is being produced.
              Water  drive  is  the  most  efficient  drive  mechanism  for  producing  oil.  Pressure
           support and displacement of oil by water helps reduce the rate of pressure depletion.
           Recovery efficiencies for the most common depletion drive mechanisms for primary
           production are shown in Table 13.5.
              In some cases, reservoir dip is so large that gravity drainage is an important natural
           drive mechanism during primary depletion of an undersaturated oil reservoir. The
           East Texas oil field is an example of a gravity drainage oil field. The giant oil field
           was discovered in 1930, and oil production to date exceeds five billion barrels of oil.
           The East Texas oil field is the part of the Woodbine sand that is wedged between the