
Page 280 - Introduction to Petroleum Engineering
P. 280
ACTIVITIES 267
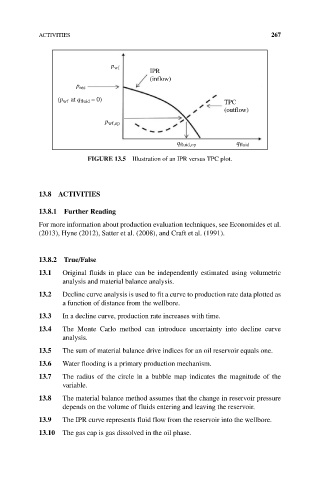
p wf
IPR
(inflow)
p res
(p wf at q fluid = 0) TPC
(outflow)
p wf,op
q fluid,op q fluid
FIgURE 13.5 Illustration of an IPR versus TPC plot.
13.8 ACTIVITIES
13.8.1 Further Reading
For more information about production evaluation techniques, see Economides et al.
(2013), Hyne (2012), Satter et al. (2008), and Craft et al. (1991).
13.8.2 True/False
13.1 Original fluids in place can be independently estimated using volumetric
analysis and material balance analysis.
13.2 Decline curve analysis is used to fit a curve to production rate data plotted as
a function of distance from the wellbore.
13.3 In a decline curve, production rate increases with time.
13.4 The Monte Carlo method can introduce uncertainty into decline curve
analysis.
13.5 The sum of material balance drive indices for an oil reservoir equals one.
13.6 Water flooding is a primary production mechanism.
13.7 The radius of the circle in a bubble map indicates the magnitude of the
variable.
13.8 The material balance method assumes that the change in reservoir pressure
depends on the volume of fluids entering and leaving the reservoir.
13.9 The IPR curve represents fluid flow from the reservoir into the wellbore.
13.10 The gas cap is gas dissolved in the oil phase.