
Page 307 - Introduction to Petroleum Engineering
P. 307
296 MIDSTREAM AND DOWNSTREAM OPERATIONS
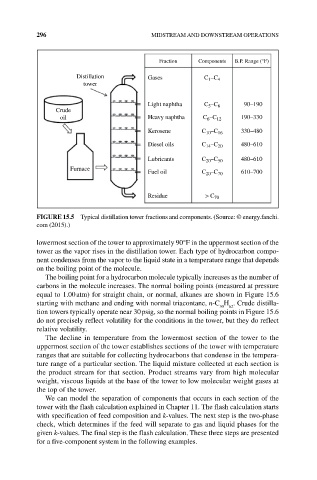
Fraction Components B.P. Range (°F)
Distillation Gases C 1 –C 4
tower
Light naphtha C 5 –C 6 90–190
Crude
oil Heavy naphtha C 6 –C 12 190–330
Kerosene C 10 –C 16 330–480
Diesel oils C 14 –C 20 480–610
Lubricants C 20 –C 50 480–610
Furnace Fuel oil C 20 –C 70 610–700
Residue > C 70
FIguRE 15.5 Typical distillation tower fractions and components. (Source: © energy.fanchi.
com (2015).)
lowermost section of the tower to approximately 90°F in the uppermost section of the
tower as the vapor rises in the distillation tower. Each type of hydrocarbon compo-
nent condenses from the vapor to the liquid state in a temperature range that depends
on the boiling point of the molecule.
The boiling point for a hydrocarbon molecule typically increases as the number of
carbons in the molecule increases. The normal boiling points (measured at pressure
equal to 1.00 atm) for straight chain, or normal, alkanes are shown in Figure 15.6
starting with methane and ending with normal triacontane, n‐C H . Crude distilla-
62
30
tion towers typically operate near 30 psig, so the normal boiling points in Figure 15.6
do not precisely reflect volatility for the conditions in the tower, but they do reflect
relative volatility.
The decline in temperature from the lowermost section of the tower to the
uppermost section of the tower establishes sections of the tower with temperature
ranges that are suitable for collecting hydrocarbons that condense in the tempera-
ture range of a particular section. The liquid mixture collected at each section is
the product stream for that section. Product streams vary from high molecular
weight, viscous liquids at the base of the tower to low molecular weight gases at
the top of the tower.
We can model the separation of components that occurs in each section of the
tower with the flash calculation explained in Chapter 11. The flash calculation starts
with specification of feed composition and k‐values. The next step is the two‐phase
check, which determines if the feed will separate to gas and liquid phases for the
given k‐values. The final step is the flash calculation. These three steps are presented
for a five‐component system in the following examples.