
Page 44 - Introduction to Petroleum Engineering
P. 44
28 THE FUTURE OF ENERGY
are characterized by the mean μ and standard deviation σ of the distribution.
Based on the SPE‐PRMS reserves definitions for proved, probable, and possible
reserves, we have
.
Provedreserves = P 90 = µ −128σ
Probablereserves = P 50 = µ (2.1)
.
Possibleresserves = P 10 = µ +128σ
for a normal distribution with mean μ and standard deviation σ.
Example 2.1 Reserves
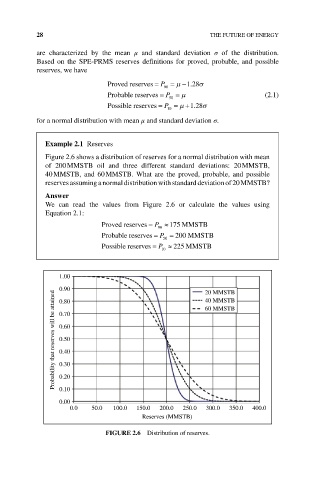
Figure 2.6 shows a distribution of reserves for a normal distribution with mean
of 200 MMSTB oil and three different standard deviations: 20 MMSTB,
40 MMSTB, and 60 MMSTB. What are the proved, probable, and possible
reserves assuming a normal distribution with standard deviation of 20 MMSTB?
Answer
We can read the values from Figure 2.6 or calculate the values using
Equation 2.1:
Provedreserves = P 90 ≈175 MMSTB
Probablereserves = P 50 = 200 MMSTB
Posssiblereserves = P 10 ≈ 225 MMSTB
1.00
0.90 20 MMSTB
Probability that reserves will be attained 0.60
40 MMSTB
0.80
60 MMSTB
0.70
0.50
0.40
0.30
0.20
0.10
0.00
0.0 50.0 100.0 150.0 200.0 250.0 300.0 350.0 400.0
Reserves (MMSTB)
FIGURE 2.6 Distribution of reserves.