
Page 40 - Introduction to Petroleum Engineering
P. 40
24 THE FUTURE OF ENERGY
Total oil supply
16 000
United States China
Saudi Arabia Canada
14 000
Russia
12 000
Thousand barrels per day 10000
8000
6000
4000
2000
0
2000 2002 2004 2006 2008 2010 2012 2014 2016
End of year
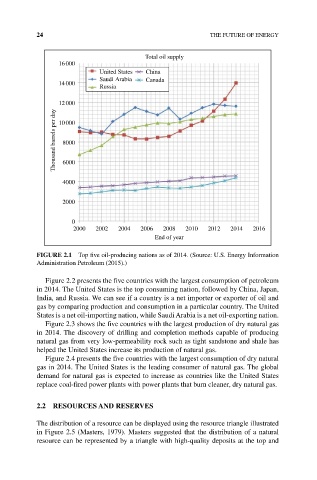
FIGURE 2.1 Top five oil‐producing nations as of 2014. (Source: U.S. Energy Information
Administration Petroleum (2015).)
Figure 2.2 presents the five countries with the largest consumption of petroleum
in 2014. The United States is the top consuming nation, followed by China, Japan,
India, and Russia. We can see if a country is a net importer or exporter of oil and
gas by comparing production and consumption in a particular country. The United
States is a net oil‐importing nation, while Saudi Arabia is a net oil‐exporting nation.
Figure 2.3 shows the five countries with the largest production of dry natural gas
in 2014. The discovery of drilling and completion methods capable of producing
natural gas from very low‐permeability rock such as tight sandstone and shale has
helped the United States increase its production of natural gas.
Figure 2.4 presents the five countries with the largest consumption of dry natural
gas in 2014. The United States is the leading consumer of natural gas. The global
demand for natural gas is expected to increase as countries like the United States
replace coal‐fired power plants with power plants that burn cleaner, dry natural gas.
2.2 RESOURCES AND RESERVES
The distribution of a resource can be displayed using the resource triangle illustrated
in Figure 2.5 (Masters, 1979). Masters suggested that the distribution of a natural
resource can be represented by a triangle with high‐quality deposits at the top and