
Page 199 - Laboratory Manual in Physical Geology
P. 199
A CTIVIT Y 6.5 Sediment Analysis, Classification, and Interpretation
Name: ______________________________________ Course/Section: ______________________ Date: ___________
Complete parts 1 through 6 for each sample below. Refer to FIGURES 6.2 and 6.3 as needed.
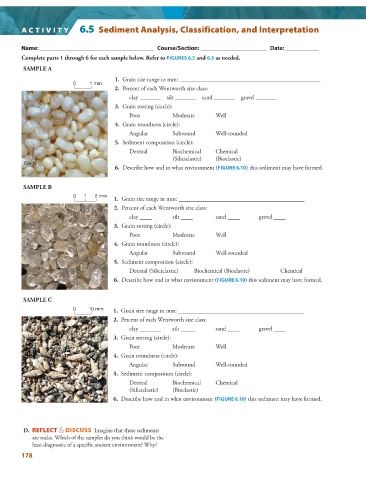
SAMPLE A
1. Grain size range in mm: _______________________________________________
0 1 mm
2. Percent of each Wentworth size class:
clay _______ silt _______ sand _______ gravel _______
3. Grain sorting (circle):
Poor Moderate Well
4. Grain roundness (circle):
Angular Subround Well-rounded
5. Sediment composition (circle):
Detrital Biochemical Chemical
(Siliciclastic) (Bioclastic)
Ooids
6. Describe how and in what environment ( FIGURE 6.10 ) this sediment may have formed.
SAMPLE B
0 1 2 mm
1. Grain size range in mm: __________________________________________
2. Percent of each Wentworth size class:
clay ____ silt ____ sand ____ gravel ____
3. Grain sorting (circle):
Poor Moderate Well
4. Grain roundness (circle):
Angular Subround Well-rounded
5. Sediment composition (circle):
Detrital (Siliciclastic) Biochemical (Bioclastic) Chemical
6. Describe how and in what environment ( FIGURE 6.10 ) this sediment may have formed.
SAMPLE C
0 10 mm 1. Grain size range in mm: __________________________________________
2. Percent of each Wentworth size class:
clay _______ silt _____ sand ____ gravel ____
3. Grain sorting (circle):
Poor Moderate Well
4. Grain roundness (circle):
Angular Subround Well-rounded
5. Sediment composition (circle):
Detrital Biochemical Chemical
(Siliciclastic) (Bioclastic)
6. Describe how and in what environment ( FIGURE 6.10 ) this sediment may have formed.
D. REFLECT & DISCUSS Imagine that these sediments
are rocks. Which of the samples do you think would be the
least diagnostic of a specific ancient environment? Why?
178