
Page 174 - Lean six sigma demystified
P. 174
Chapter 5 Redu C ing d efe C t S with Six Sigm a 153
2.5
G
O
2
Number of false fire alarms 1.5
O
D
1
0.5
0
Jan Feb Mar Apr May Jun Jul Aug
1990
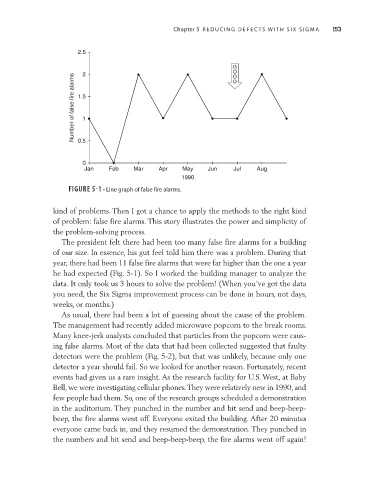
FIGURE 5-1 • Line graph of false fire alarms.
kind of problems. Then I got a chance to apply the methods to the right kind
of problem: false fire alarms. This story illustrates the power and simplicity of
the problem-solving process.
The president felt there had been too many false fire alarms for a building
of our size. In essence, his gut feel told him there was a problem. During that
year, there had been 11 false fire alarms that were far higher than the one a year
he had expected (Fig. 5-1). So I worked the building manager to analyze the
data. It only took us 3 hours to solve the problem! (When you’ve got the data
you need, the Six Sigma improvement process can be done in hours, not days,
weeks, or months.)
As usual, there had been a lot of guessing about the cause of the problem.
The management had recently added microwave popcorn to the break rooms.
Many knee-jerk analysts concluded that particles from the popcorn were caus-
ing false alarms. Most of the data that had been collected suggested that faulty
detectors were the problem (Fig. 5-2), but that was unlikely, because only one
detector a year should fail. So we looked for another reason. Fortunately, recent
events had given us a rare insight. As the research facility for U.S. West, at Baby
Bell, we were investigating cellular phones. They were relatively new in 1990, and
few people had them. So, one of the research groups scheduled a demonstration
in the auditorium. They punched in the number and hit send and beep-beep-
beep, the fire alarms went off. Everyone exited the building. After 20 minutes
everyone came back in, and they resumed the demonstration. They punched in
the numbers and hit send and beep-beep-beep, the fire alarms went off again!