
Page 258 - Lean six sigma demystified
P. 258
236 Lean Six Sigma DemystifieD
Distributions
It doesn’t matter if you’re measuring height, weight, width, diameter, thickness,
volume, time, or money; if you measure the same dimension over time, it will
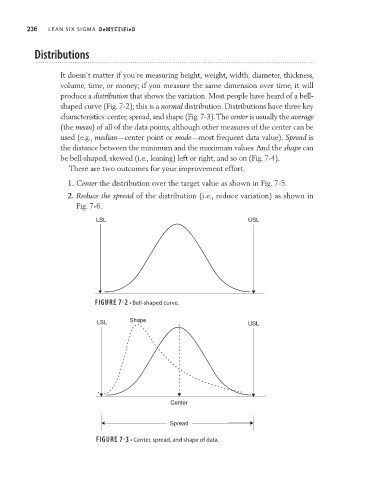
produce a distribution that shows the variation. Most people have heard of a bell-
shaped curve (Fig. 7-2); this is a normal distribution. Distributions have three key
characteristics: center, spread, and shape (Fig. 7-3). The center is usually the average
(the mean) of all of the data points, although other measures of the center can be
used (e.g., median—center point or mode—most frequent data value). Spread is
the distance between the minimum and the maximum values. And the shape can
be bell-shaped, skewed (i.e., leaning) left or right, and so on (Fig. 7-4).
There are two outcomes for your improvement effort.
1. Center the distribution over the target value as shown in Fig. 7-5.
2. Reduce the spread of the distribution (i.e., reduce variation) as shown in
Fig. 7-6.
LSL USL
FIgure 7-2 • Bell-shaped curve.
LSL Shape USL
Center
Spread
FIgure 7-3 • Center, spread, and shape of data.