
Page 260 - Lean six sigma demystified
P. 260
238 Lean Six Sigma DemystifieD
These two outcomes can be easily monitored using histograms which help
you determine the capability of your process.
Histograms and Capability
Perhaps the easiest way to determine the center, spread, and shape of your
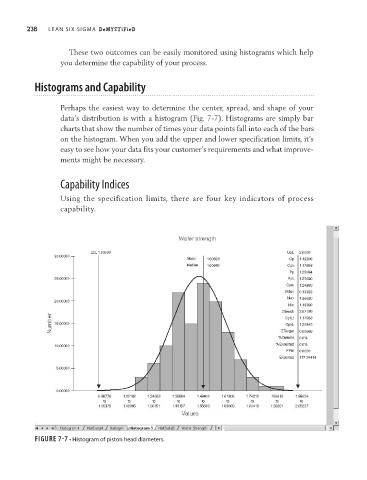
data’s distribution is with a histogram (Fig. 7-7). Histograms are simply bar
charts that show the number of times your data points fall into each of the bars
on the histogram. When you add the upper and lower specification limits, it’s
easy to see how your data fits your customer’s requirements and what improve-
ments might be necessary.
Capability Indices
Using the specification limits, there are four key indicators of process
capability.
FIgure 7-7 • Histogram of piston head diameters.