Page 265 - Lean six sigma demystified
P. 265

Chapter 7  Redu C ing  Va R iation  with   Six   Sigm a          243


                            Process Capability Indicators                   Improvement Objective

                            If Cp is greater than Cpk                       Center the process
                            Cp > Cpk
                            If Cp is approximately equal to Cpk and both are   Reduce variation
                            less than 1.33
                            Cp = Cpk < 1.33


                           Root Cause Analysis

                           Again, you can use the Ishikawa (fishbone) diagram to analyze the root
                           causes of (1) off-center or (2) excess variation. Remember, common causes
                           of variation may require systemic changes to achieve your capability goals.
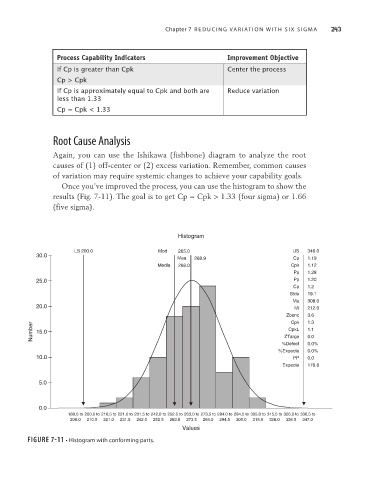
                             Once you’ve improved the process, you can use the histogram to show the
                           results (Fig. 7-11). The goal is to get Cp = Cpk > 1.33 (four sigma) or 1.66
                           (five sigma).


                                                              Histogram

                                 LS 200.0               Mod   265.0                           US  346.0
                      30.0
                                                              Mea  268.9                      Cp  1.19
                                                        Media  268.0                         Cpk  1.12
                                                                                              Pp  1.28
                      25.0                                                                    Pp  1.20
                                                                                              Cp  1.2
                                                                                             Stde  19.1
                                                                                              Ma  308.0
                      20.0                                                                    Mi  212.0
                                                                                            Zbenc  3.6
                                                                                                  1.3
                                                                                             Cpk
                     Number  15.0                                                          ZTarge  1.1
                                                                                             CpkL
                                                                                                  0.0
                                                                                           %Defect  0.0%
                                                                                          %Expecte  0.0%
                      10.0                                                                    PP  0.0
                                                                                           Expecte  176.8
                       5.0


                       0.0
                               189.5 to 200.0 to 210.5 to 221.0 to 231.5 to 242.0 to 252.5 to 263.0 to 273.5 to 284.0 to 294.5 to 305.0 to 315.5 to 326.0 to 336.5 to
                                200.0  210.5  221.0  231.5  242.0  252.5  263.0  273.5  284.0  294.5  305.0  315.5  326.0  336.5  347.0
                                                               Values
                    FIgure 7-11 • Histogram with conforming parts.
   260   261   262   263   264   265   266   267   268   269   270