
Page 127 - Materials Chemistry, Second Edition
P. 127
Life Cycle Assessment: Principles, Practice and Prospects
114
Infrastructure
Farm
and minor services,
establishment
ancillary materials
Agricultural
machinery Energy and
production and Field preparation ancillary materials
operation
Fertiliser and Planting, fertilising Across life cycle
pesticide and pesticide
production application
Crop growing Corn grain
and harvesting separation
Grain transport
Plowing stubble to product
back into field
manufacture
Processing grain
to corn chips
Packaging and Consumption of
delivery corn chips
Disposal of
packaging
Landfill
System boundary for LCA
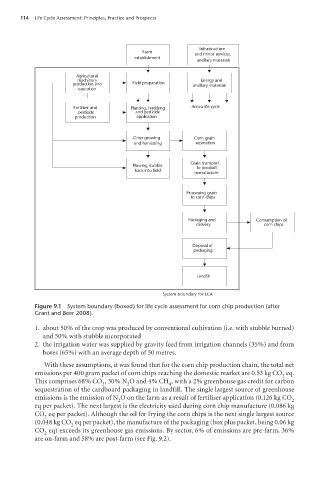
Figure 9.1 System boundary (boxed) for life cycle assessment for corn chip production (after
Grant and Beer 2008).
1. about 50% of the crop was produced by conventional cultivation (i.e. with stubble burned)
and 50% with stubble incorporated
2. the irrigation water was supplied by gravity feed from irrigation channels (35%) and from
bores (65%) with an average depth of 50 metres.
With these assumptions, it was found that for the corn chip production chain, the total net
emissions per 400 gram packet of corn chips reaching the domestic market are 0.53 kg CO eq.
2
This comprises 68% CO , 30% N O and 4% CH , with a 2% greenhouse gas credit for carbon
2 2 4
sequestration of the cardboard packaging in landfill. The single largest source of greenhouse
emissions is the emission of N O on the farm as a result of fertiliser application (0.126 kg CO
2 2
eq per packet). The next largest is the electricity used during corn chip manufacture (0.086 kg
CO eq per packet). Although the oil for frying the corn chips is the next single largest source
2
(0.048 kg CO eq per packet), the manufacture of the packaging (box plus packet, being 0.06 kg
2
CO eq) exceeds its greenhouse gas emissions. By sector, 6% of emissions are pre-farm, 36%
2
are on-farm and 58% are post-farm (see Fig. 9.2).
100804•Life Cycle Assessment 5pp.indd 114 17/02/09 12:46:22 PM