
Page 128 - Materials Chemistry, Second Edition
P. 128
Fertiliser Life cycle assessment and agriculture: challenges and prospects 115
Pesticide
Herbicide Pre farm
Fuel production
Water pumping
N O from fertiliser applied
2
N2O from land disturbances
On farm
Tractor emissions
Pesticide and herbicide degradation
Drying maize
Transport farm to corn chips
Electricity in corn chip processing
Natural gas use in corn chip processing
Oil for frying
Seasoning Post farm
Bag for 400g of corn chips
Box (for transporting corn chips packets)
Transport of corn chips to market
Waste management (bag and box)
0.00 0.02 0.04 0.06 0.08 0.10 0.12 0.14
Carbon dioxide equivalents (kg CO )
2
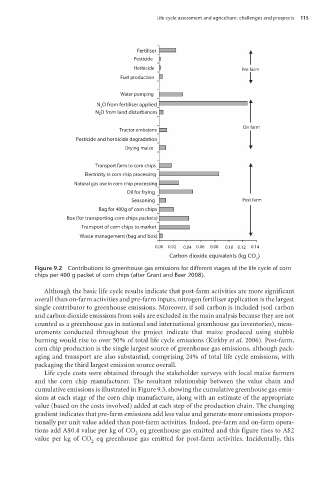
Figure 9.2 Contributions to greenhouse gas emissions for different stages of the life cycle of corn
chips per 400 g packet of corn chips (after Grant and Beer 2008).
Although the basic life cycle results indicate that post-farm activities are more significant
overall than on-farm activities and pre-farm inputs, nitrogen fertiliser application is the largest
single contributor to greenhouse emissions. Moreover, if soil carbon is included (soil carbon
and carbon dioxide emissions from soils are excluded in the main analysis because they are not
counted as a greenhouse gas in national and international greenhouse gas inventories), meas-
urements conducted throughout the project indicate that maize produced using stubble
burning would rise to over 50% of total life cycle emissions (Kirkby et al. 2006). Post-farm,
corn chip production is the single largest source of greenhouse gas emissions, although pack-
aging and transport are also substantial, comprising 24% of total life cycle emissions, with
packaging the third largest emission source overall.
Life cycle costs were obtained through the stakeholder surveys with local maize farmers
and the corn chip manufacturer. The resultant relationship between the value chain and
cumulative emissions is illustrated in Figure 9.3, showing the cumulative greenhouse gas emis-
sions at each stage of the corn chip manufacture, along with an estimate of the appropriate
value (based on the costs involved) added at each step of the production chain. The changing
gradient indicates that pre-farm emissions add less value and generate more emissions propor-
tionally per unit value added than post-farm activities. Indeed, pre-farm and on-farm opera-
tions add A$0.4 value per kg of CO eq greenhouse gas emitted and this figure rises to A$2
2
value per kg of CO eq greenhouse gas emitted for post-farm activities. Incidentally, this
2
100804•Life Cycle Assessment 5pp.indd 115 17/02/09 12:46:22 PM