
Page 78 - Materials Chemistry, Second Edition
P. 78
Life cycle assessment and waste management
Technology Key assumptions Description of process 65
Incineration Output is 32.5% of input. Bottom ash, A well-proven waste processing
of MSW sent to landfill, accounts for 30% of technology overseas, extensively used
input. Fly ash, also sent to landfill, in Europe, USA and Japan. Involves the
accounts for 2.5% of input; 400 kWh/t combustion of waste, usually in a grate
net electricity generation (no kiln, and produces electricity, slag and
combined heat and power). ash.
Recovery 20% for paper and cardboard and For scenarios A1 and A2 (Table 6.3),
rates in glass, 30% for plastics and 75% for advanced front-end separation has
front-end metals been assumed for recovery of
separation recyclables
Benefits of 2.5% increase in crop yield through increase in water-holding capacity
using (estimated on wheat crop). Fertiliser replacement of 1.5% N and 0.25% for K
compost from and P. Nitrous oxide emission savings. 20% reduction in pesticide use. 10% of
green and carbon sequestered in soil.
food waste
Benefits of 10% of carbon is sequestered in the soil
using
compost from
MSW
A The digester feedstock would predominantly be food waste, with the bulkier garden waste being added at the end of
the process (i.e. composting).
CO , carbon dioxide; K, potassium; MSW, municipal solid waste; N, nitrogen; P, phosphorus.
2
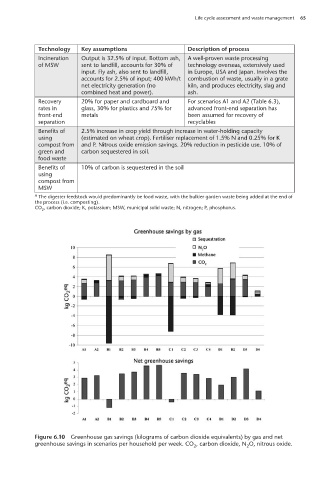
Figure 6.10 Greenhouse gas savings (kilograms of carbon dioxide equivalents) by gas and net
greenhouse savings in scenarios per household per week. CO , carbon dioxide, N O, nitrous oxide.
2
2
100804•Life Cycle Assessment 5pp.indd 65 17/02/09 12:46:18 PM