
Page 79 - Materials Chemistry, Second Edition
P. 79
Life Cycle Assessment: Principles, Practice and Prospects
66
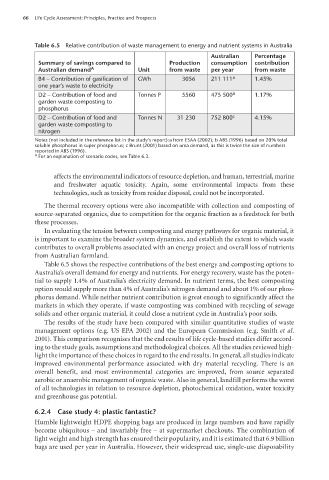
Table 6.5 Relative contribution of waste management to energy and nutrient systems in Australia
Australian Percentage
Summary of savings compared to Production consumption contribution
Australian demand A Unit from waste per year from waste
B4 – Contribution of gasification of GWh 3056 211 111 a 1.45%
one year’s waste to electricity
D2 – Contribution of food and Tonnes P 5560 475 500 b 1.17%
garden waste composting to
phosphorus
D2 – Contribution of food and Tonnes N 31 230 752 800 c 4.15%
garden waste composting to
nitrogen
Notes (not included in the reference list in the study’s report):a from ESAA (2002); b ABS (1996) based on 20% total
soluble phosphorus in super phosphorus; c Brunt (2001) based on urea demand, as this is twice the size of numbers
reported in ABS (1996).
A For an explanation of scenario codes, see Table 6.3.
affects the environmental indicators of resource depletion, and human, terrestrial, marine
and freshwater aquatic toxicity. Again, some environmental impacts from these
technologies, such as toxicity from residue disposal, could not be incorporated.
The thermal recovery options were also incompatible with collection and composting of
source-separated organics, due to competition for the organic fraction as a feedstock for both
these processes.
In evaluating the tension between composting and energy pathways for organic material, it
is important to examine the broader system dynamics, and establish the extent to which waste
contributes to overall problems associated with an energy project and overall loss of nutrients
from Australian farmland.
Table 6.5 shows the respective contributions of the best energy and composting options to
Australia’s overall demand for energy and nutrients. For energy recovery, waste has the poten-
tial to supply 1.4% of Australia’s electricity demand. In nutrient terms, the best composting
option would supply more than 4% of Australia’s nitrogen demand and about 1% of our phos-
phorus demand. While neither nutrient contribution is great enough to significantly affect the
markets in which they operate, if waste composting was combined with recycling of sewage
solids and other organic material, it could close a nutrient cycle in Australia’s poor soils.
The results of the study have been compared with similar quantitative studies of waste
management options (e.g. US EPA 2002) and the European Commission (e.g. Smith et al.
2001). This comparison recognises that the end results of life cycle-based studies differ accord-
ing to the study goals, assumptions and methodological choices. All the studies reviewed high-
light the importance of these choices in regard to the end results. In general, all studies indicate
improved environmental performance associated with dry material recycling. There is an
overall benefit, and most environmental categories are improved, from source separated
aerobic or anaerobic management of organic waste. Also in general, landfill performs the worst
of all technologies in relation to resource depletion, photochemical oxidation, water toxicity
and greenhouse gas potential.
6.2.4 Case study 4: plastic fantastic?
Humble lightweight HDPE shopping bags are produced in large numbers and have rapidly
become ubiquitous – and invariably free – at supermarket checkouts. The combination of
light weight and high strength has ensured their popularity, and it is estimated that 6.9 billion
bags are used per year in Australia. However, their widespread use, single-use disposability
100804•Life Cycle Assessment 5pp.indd 66 17/02/09 12:46:18 PM