
Page 151 - Materials Chemistry, Second Edition
P. 151
134 LIFE CYCLE ASSESSMENT HANDBOOK
Another challenge to using public databases is the difficulty in aggregating
facility data for the precise group of facilities for which one may want data.
Aggregating by SIC code generally groups facilities into too broad a category
to be useful for LCA. An example is SIC code 3312, Steel Works, Blast Furnaces
(including Coke Ovens), and Rolling Establishments. If one is interested in
facilities that manufacture only steel tubing, SIC code 3312 is too broad of
a category to provide useful information. The ability to aggregate on some
smaller segment of industry would be extremely useful. Ideally, the names
and addresses of facilities that produce the material or product of interest are
known and the researcher can simply collect data for those facilities. This may
be the case for LCA studies with a very narrow scope, but is generally not the
case for LCA studies that include commodity products.
5.8 Creating Life Cycle Inventory using Economic
Input/Output Data
Economic Input/Output (EIO) analysis is an economic discipline that models
the interdependencies of production and consumption between industries and
households within a nation's economy. The input/output model divides an
entire economy into distinct sectors and represents them in table, or matrix,
form so that each sector is represented by one row and one column. The matrix
represents sales from one sector to another. The economic input-output model
is linear so the effects of purchasing $1,000 from one sector will be ten times
greater than the effects of purchasing $100 from that sector.
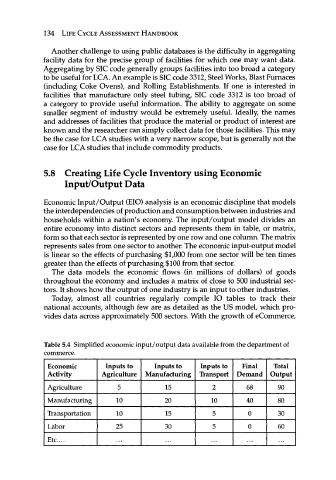
The data models the economic flows (in millions of dollars) of goods
throughout the economy and includes a matrix of close to 500 industrial sec-
tors. It shows how the output of one industry is an input to other industries.
Today, almost all countries regularly compile IO tables to track their
national accounts, although few are as detailed as the US model, which pro-
vides data across approximately 500 sectors. With the growth of eCommerce,
Table 5.4 Simplified economic input/output data available from the department of
commerce.
Economic Inputs to Inputs to Inputs to Final Total
Activity Agriculture Manufacturing Transport Demand Output
Agriculture 5 15 2 68 90 |
Manufacturing 10 20 10 40 80
Transportation 10 15 5 0 30
Labor 25 30 5 0 60
Etc....