
Page 131 - Materials Chemistry, Second Edition
P. 131
Life Cycle Assessment of Biodiesel from Palm Oil 117
highest energy consumption (67 % of total input fuel) was recorded in this stage.
This shows positive environmental impacts because it releases insignificant air
emissions upon combustion.
Plantation stage recorded highly significant human energy input (97 % of total
human energy input) compared to other energy inputs (5 % of total energy input)
such as diesel.
According to Henson (2004), palm oil mills are self-sufficient for electricity and
heat. It has been reported (Husain et al. 2003) that the total heat and power
generation for every tonne of FFB is about 1181 MJ (approximately 0.7 t steam).
Within the mill, energy could be released as emissions into the atmosphere which
is estimated to be 16 MJ per tonne FFB (Subramaniam 2006). It is assumed that
the energy produced is more than the energy required by the mill; hence, the
surplus is released into the atmosphere.
The highest water requirement for the whole production came from the oil palm
plantation stage (contributing 99.6 % of the total water requirement).
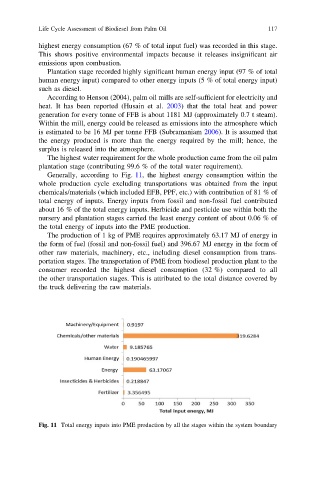
Generally, according to Fig. 11, the highest energy consumption within the
whole production cycle excluding transportations was obtained from the input
chemicals/materials (which included EFB, PPF, etc.) with contribution of 81 % of
total energy of inputs. Energy inputs from fossil and non-fossil fuel contributed
about 16 % of the total energy inputs. Herbicide and pesticide use within both the
nursery and plantation stages carried the least energy content of about 0.06 % of
the total energy of inputs into the PME production.
The production of 1 kg of PME requires approximately 63.17 MJ of energy in
the form of fuel (fossil and non-fossil fuel) and 396.67 MJ energy in the form of
other raw materials, machinery, etc., including diesel consumption from trans-
portation stages. The transportation of PME from biodiesel production plant to the
consumer recorded the highest diesel consumption (32 %) compared to all
the other transportation stages. This is attributed to the total distance covered by
the truck delivering the raw materials.
Fig. 11 Total energy inputs into PME production by all the stages within the system boundary