
Page 202 - Materials Chemistry, Second Edition
P. 202
190 B. Ruggeri et al.
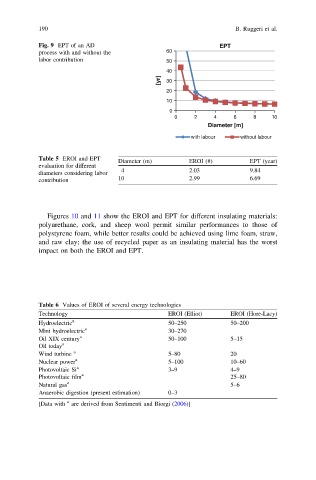
Fig. 9 EPT of an AD EPT
process with and without the 60
labor contribution 50
40
[yr] 30
20
10
0
0 2 4 6 8 10
Diameter [m]
with labour without labour
Table 5 EROI and EPT Diameter (m) EROI (#) EPT (year)
evaluation for different
diameters considering labor 4 2.03 9.84
contribution 10 2.99 6.69
Figures 10 and 11 show the EROI and EPT for different insulating materials:
polyurethane, cork, and sheep wool permit similar performances to those of
polystyrene foam, while better results could be achieved using lime foam, straw,
and raw clay; the use of recycled paper as an insulating material has the worst
impact on both the EROI and EPT.
Table 6 Values of EROI of several energy technologies
Technology EROI (Elliot) EROI (Hore-Lacy)
Hydroelectric a 50–250 50–200
Mini hydroelectric a 30–270
Oil XIX century a 50–100 5–15
Oil today a
Wind turbine a 5–80 20
Nuclear power a 5–100 10–60
Photovoltaic Si a 3–9 4–9
Photovoltaic film a 25–80
Natural gas a 5–6
Anaerobic digestion (present estimation) 0–3
[Data with a are derived from Sentimenti and Biorgi (2006)]