
Page 242 - Materials Chemistry, Second Edition
P. 242
Comparing Various Indicators for the LCA 231
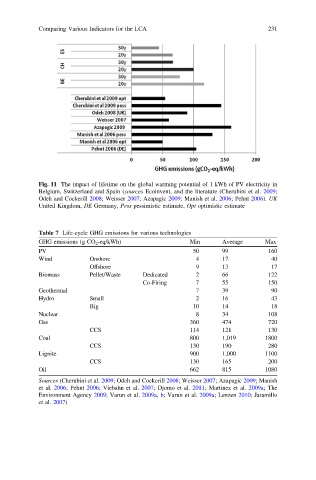
Fig. 11 The impact of lifetime on the global warming potential of 1 kWh of PV electricity in
Belgium, Switzerland and Spain (sources Ecoinvent, and the literature (Cherubini et al. 2009;
Odeh and Cockerill 2008; Weisser 2007; Azapagic 2009; Manish et al. 2006; Pehnt 2006). UK
United Kingdom, DE Germany, Pess pessimistic estimate, Opt optimistic estimate
Table 7 Life-cycle GHG emissions for various technologies
GHG emissions (g CO 2 -eq/kWh) Min Average Max
PV 50 99 160
Wind Onshore 4 17 40
Offshore 9 13 17
Biomass Pellet/Waste Dedicated 2 66 122
Co-Firing 7 55 150
Geothermal 7 39 90
Hydro Small 2 16 43
Big 10 14 18
Nuclear 8 34 108
Gas 360 474 720
CCS 114 121 130
Coal 800 1,019 1800
CCS 130 190 280
Lignite 900 1,000 1100
CCS 130 165 200
Oil 662 815 1080
Sources (Cherubini et al. 2009; Odeh and Cockerill 2008; Weisser 2007; Azapagic 2009; Manish
et al. 2006; Pehnt 2006; Viebahn et al. 2007; Djomo et al. 2011; Martinez et al. 2009a; The
Environment Agency 2009; Varun et al. 2009a, b; Varun et al. 2009a; Lenzen 2010; Jaramillo
et al. 2007)