
Page 240 - Materials Chemistry, Second Edition
P. 240
Comparing Various Indicators for the LCA 229
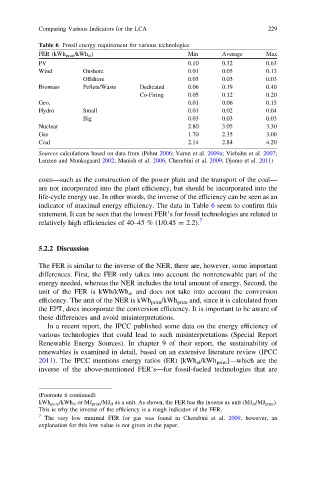
Table 6 Fossil energy requirement for various technologies
FER (kWh prim /kWh el ) Min Average Max
PV 0.10 0.32 0.63
Wind Onshore 0.01 0.05 0.13
Offshore 0.03 0.03 0.03
Biomass Pellets/Waste Dedicated 0.06 0.19 0.40
Co-Firing 0.05 0.12 0.20
Geo. 0.01 0.06 0.15
Hydro Small 0.01 0.02 0.04
Big 0.03 0.03 0.03
Nuclear 2.80 3.05 3.30
Gas 1.70 2.35 3.00
Coal 2.14 2.84 4.20
Sources calculations based on data from (Pehnt 2006; Varun et al. 2009a; Viebahn et al. 2007;
Lenzen and Munksgaard 2002; Manish et al. 2006; Cherubini et al. 2009; Djomo et al. 2011)
costs—such as the construction of the power plant and the transport of the coal—
are not incorporated into the plant efficiency, but should be incorporated into the
life-cycle energy use. In other words, the inverse of the efficiency can be seen as an
indicator of maximal energy efficiency. The data in Table 6 seem to confirm this
statement. It can be seen that the lowest FER’s for fossil technologies are related to
relatively high efficiencies of 40–45 % (1/0.45 = 2.2). 7
5.2.2 Discussion
The FER is similar to the inverse of the NER, there are, however, some important
differences. First, the FER only takes into account the nonrenewable part of the
energy needed, whereas the NER includes the total amount of energy. Second, the
unit of the FER is kWh/kWh el and does not take into account the conversion
efficiency. The unit of the NER is kWh prim /kWh prim and, since it is calculated from
the EPT, does incorporate the conversion efficiency. It is important to be aware of
these differences and avoid misinterpretations.
In a recent report, the IPCC published some data on the energy efficiency of
various technologies that could lead to such misinterpretations (Special Report
Renewable Energy Sources). In chapter 9 of their report, the sustainability of
renewables is examined in detail, based on an extensive literature review (IPCC
2011). The IPCC mentions energy ratios (ER) [kWh el /kWh prim ]—which are the
inverse of the above-mentioned FER’s—for fossil-fueled technologies that are
(Footnote 6 continued)
kWh prim /kWh el or MJ prim /MJ el as a unit. As shown, the FER has the inverse as unit (MJ el /MJ prim ).
This is why the inverse of the efficiency is a rough indicator of the FER.
7
The very low minimal FER for gas was found in Cherubini et al. 2009, however, an
explanation for this low value is not given in the paper.