
Page 56 - Materials Chemistry, Second Edition
P. 56
42 N. E. Korres
Independence and Security Act (EISA) in which GHG reduction thresholds from a
2005 baseline are imposed. The EISA dictates 20% reductions for renewable fuels,
50% for advance fuels, 50% for biomass-based fuels, and 60% for cellulosic
biofuels (EPA 2010). It is obvious from the above that the role of lignocellulosic
materials in bioenergy arena will be proved in the near future very significant. This
is the reason why this chapter will be focused on the lignocellulosic biomass and
second-generation biofuels (i.e., biogas and bioethanol) rather that the typical first-
generation liquid biofuels. Finally, as reported by FAO (2008), the production of
liquid biofuels in many countries is not currently economically viable without
subsidies, given existing agricultural production and biofuel processing technol-
ogies and recent relative prices of commodity feedstocks and crude oil.
3.1 Biogas Production from Lignocellulosic Materials
Lignocellulosic materials and non-food/organic waste used for biogas production
can be crops such as grass or maize silage (Korres et al. 2010; McEniry et al. 2013;
Neureiter 2013), agricultural residues, and by-products (Nuri et al. 2008; Parawira
et al. 2008; Holm-Nielsen et al. 2009; Rao et al. 2010; Eze and Ojike 2012) algae
(Bruton et al. 2009; US DOE 2010; Brennan and Owende 2010; Benzie and Hynes
2013;), industrial and organic wastes (Salminen and Rintala 2002; Dearman and
Bentham 2007; Zhang et al. 2007; Fountoulakis and Manios 2009; Beno et al.
2009; Ortner et al. 2013; Singh 2013) or other lignocellulosic or organic materials
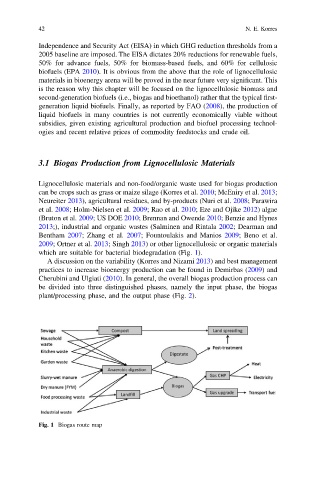
which are suitable for bacterial biodegradation (Fig. 1).
A discussion on the variability (Korres and Nizami 2013) and best management
practices to increase bioenergy production can be found in Demirbas (2009) and
Cherubini and Ulgiati (2010). In general, the overall biogas production process can
be divided into three distinguished phases, namely the input phase, the biogas
plant/processing phase, and the output phase (Fig. 2).
Fig. 1 Biogas route map