
Page 71 - Materials Chemistry, Second Edition
P. 71
The Application of Life Cycle Assessment on Agricultural 57
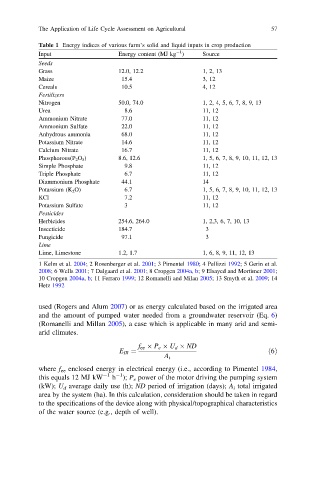
Table 1 Energy indices of various farm’s solid and liquid inputs in crop production
-1
Input Energy content (MJ kg ) Source
Seeds
Grass 12.0, 12.2 1, 2, 13
Maize 15.4 3, 12
Cereals 10.5 4, 12
Fertilizers
Nitrogen 50.0, 74.0 1, 2, 4, 5, 6, 7, 8, 9, 13
Urea 8.6 11, 12
Ammonium Nitrate 77.0 11, 12
Ammonium Sulfate 22.0 11, 12
Anhydrous ammonia 68.0 11, 12
Potassium Nitrate 14.6 11, 12
Calcium Nitrate 16.7 11, 12
Phosphorous(P 2 O 5 ) 8.6, 12.6 1, 5, 6, 7, 8, 9, 10, 11, 12, 13
Simple Phosphate 9.8 11, 12
Triple Phosphate 6.7 11, 12
Diammonium Phosphate 44.1 14
Potassium (K 2 O) 6.7 1, 5, 6, 7, 8, 9, 10, 11, 12, 13
KCl 7.2 11, 12
Potassium Sulfate 3 11, 12
Pesticides
Herbicides 254.6, 264.0 1, 2,3, 6, 7, 10, 13
Insecticide 184.7 3
Fungicide 97.1 3
Lime
Lime, Limestone 1.2, 1.7 1, 6, 8, 9, 11, 12, 13
1 Kelm et al. 2004; 2 Rosenberger et al. 2001; 3 Pimentel 1980; 4 Pellizzi 1992; 5 Gerin et al.
2008; 6 Wells 2001; 7 Dalgaard et al. 2001; 8 Cropgen 2004a, b; 9 Elsayed and Mortimer 2001;
10 Cropgen 2004a, b; 11 Ferraro 1999; 12 Romanelli and Milan 2005; 13 Smyth et al. 2009;14
Hetz 1992
used (Rogers and Alum 2007) or as energy calculated based on the irrigated area
and the amount of pumped water needed from a groundwater reservoir (Eq. 6)
(Romanelli and Millan 2005), a case which is applicable in many arid and semi-
arid climates.
f ee P e U d ND
E IR ¼ ð6Þ
A i
where f ee enclosed energy in electrical energy (i.e., according to Pimentel 1984,
-1
this equals 12 MJ kW -1 h ); P e power of the motor driving the pumping system
(kW); U d average daily use (h); ND period of irrigation (days); A i total irrigated
area by the system (ha). In this calculation, consideration should be taken in regard
to the specifications of the device along with physical/topographical characteristics
of the water source (e.g., depth of well).