
Page 78 - Materials Chemistry, Second Edition
P. 78
64 N. E. Korres
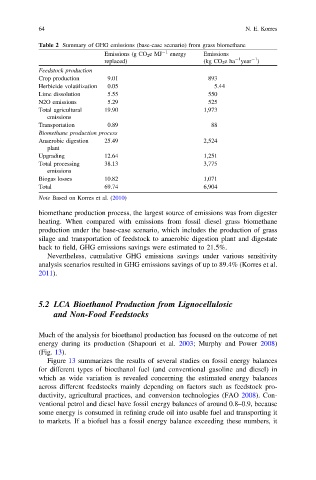
Table 2 Summary of GHG emissions (base-case scenario) from grass biomethane
Emissions (g CO 2 eMJ -1 energy Emissions
-1
-1
replaced) (kg CO 2 eha year )
Feedstock production
Crop production 9.01 893
Herbicide volatilization 0.05 5.44
Lime dissolution 5.55 550
N2O emissions 5.29 525
Total agricultural 19.90 1,973
emissions
Transportation 0.89 88
Biomethane production process
Anaerobic digestion 25.49 2,524
plant
Upgrading 12.64 1,251
Total processing 38.13 3,775
emissions
Biogas losses 10.82 1,071
Total 69.74 6,904
Note Based on Korres et al. (2010)
biomethane production process, the largest source of emissions was from digester
heating. When compared with emissions from fossil diesel grass biomethane
production under the base-case scenario, which includes the production of grass
silage and transportation of feedstock to anaerobic digestion plant and digestate
back to field, GHG emissions savings were estimated to 21.5%.
Nevertheless, cumulative GHG emissions savings under various sensitivity
analysis scenarios resulted in GHG emissions savings of up to 89.4% (Korres et al.
2011).
5.2 LCA Bioethanol Production from Lignocellulosic
and Non-Food Feedstocks
Much of the analysis for bioethanol production has focused on the outcome of net
energy during its production (Shapouri et al. 2003; Murphy and Power 2008)
(Fig. 13).
Figure 13 summarizes the results of several studies on fossil energy balances
for different types of bioethanol fuel (and conventional gasoline and diesel) in
which as wide variation is revealed concerning the estimated energy balances
across different feedstocks mainly depending on factors such as feedstock pro-
ductivity, agricultural practices, and conversion technologies (FAO 2008). Con-
ventional petrol and diesel have fossil energy balances of around 0.8–0.9, because
some energy is consumed in refining crude oil into usable fuel and transporting it
to markets. If a biofuel has a fossil energy balance exceeding these numbers, it