
Page 147 - Materials Chemistry, Second Edition
P. 147
7.2 Methods 143
Ordinal scales
1 2 3 4 5 6 7 j max –1 j max £ m
Mapping
Dg j, r = g j, r +1 –Dg j, r r = j max
g j, 1 g j, 2 g j, 3 j, 4 g j, 5 g j, 6 g j, 7 g j, jmax–1 g j, jmax
g
Cardinal values
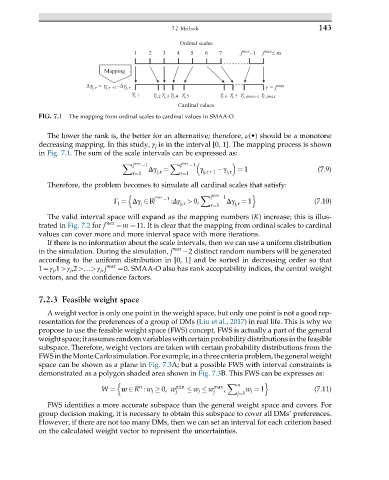
FIG. 7.1 The mapping from ordinal scales to cardinal values in SMAA-O.
The lower the rank is, the better for an alternative; therefore, ν(•) should be a monotone
decreasing mapping. In this study, γ j is in the interval [0, 1]. The mapping process is shown
in Fig. 7.1. The sum of the scale intervals can be expressed as:
X max X max
j 1 j 1
j,r γ j,r + 1 γ j,r ¼ 1 (7.9)
r¼1 r¼1
Δγ ¼
Therefore, the problem becomes to simulate all cardinal scales that satisfy:
j
n max X max 1 o
Γ j ¼ Δγ 2 R j 1 :Δγ > 0, Δγ ¼ 1 (7.10)
j,r
j,r
j
r¼1
The valid interval space will expand as the mapping numbers (K) increase; this is illus-
trated in Fig. 7.2 for j max ¼m ¼11. It is clear that the mapping from ordinal scales to cardinal
values can cover more and more interval space with more iterations.
If there is no information about the scale intervals, then we can use a uniform distribution
in the simulation. During the simulation, j max 2 distinct random numbers will be generated
according to the uniform distribution in [0, 1] and be sorted in decreasing order so that
1¼γ j ,1>γ j ,2>…>γ j ,j max ¼0. SMAA-O also has rank acceptability indices, the central weight
vectors, and the confidence factors.
7.2.3 Feasible weight space
A weight vector is only one point in the weight space, but only one point is not a good rep-
resentation for the preferences of a group of DMs (Liu et al., 2017) in real life. This is why we
propose to use the feasible weight space (FWS) concept. FWS is actually a part of the general
weight space; it assumes random variables with certain probability distributions in the feasible
subspace. Therefore, weight vectors are taken with certain probability distributions from the
FWSintheMonteCarlosimulation.Forexample,inathreecriteria problem,thegeneralweight
space can be shown as a plane in Fig. 7.3A; but a possible FWS with interval constraints is
demonstrated as a polygon shaded area shown in Fig. 7.3B. This FWS can be expresses as:
n X n o
n
W ¼ w 2 R : w j 0, w min w j w max , j¼1 w j ¼ 1 (7.11)
j
j
FWS identifies a more accurate subspace than the general weight space and covers. For
group decision making, it is necessary to obtain this subspace to cover all DMs’ preferences.
However, if there are not too many DMs, then we can set an interval for each criterion based
on the calculated weight vector to represent the uncertainties.