
Page 154 - Materials Chemistry, Second Edition
P. 154
150 7. MCDM for sustainability ranking of district heating systems considering uncertainties
weights are finally used. This can be justified by Table 7.3, e.g., when the central weight of
solar HP system is finally chosen, the cross confidence factor of gas-HOB is far bigger than
the confidence factor itself (0.021%) for solar HP. In fact, it is the smallest confidence factor,
because gas-HOB, WSHP, GSHP, and coal-CHP all have bigger cross confidence factors when
solar HP is the target alternative. This means that solar HP will not be the most preferred or
compromise alternative. The situations are similar when other two HPs’ central weights are
used, because gas-HOB will dominate the WSHP and GSHP. In other words, HPs only have
small chances to be the best alternative even if weights are close to their central weights (close
to the central weight of gas-HOB too), as shown in Fig. 7.7.
The ranking of the DH systems based on the average utility can be found in Fig. 7.6. The
same ranking can be obtained through holistic acceptability in Table 7.2. We found that the
first three rankings are the same as the result given by Wei et al. (2010). The ranking sequences
of GSHP, solar energy HP, and oil-fired HOB are also the same. The only difference is that a
coal-fired HOB ranks 4 in their conclusion, but it is apparently the worst alternative in our
study. The reason is that if total cost is emphasized, then coal-fired HOB is dominated by
coal-fired CHP, otherwise it is dominated by other DH technologies characterized by lower
emissions.
7.3.3 Discussion
Pairwise winning indices can also be defined if the above statistic variables are still not
enough to differentiate the alternatives. The pairwise winning index c ij is the probability
for alternative i to score better than alternative j considering the uncertainty in the preference
statements. It can be calculated by the times that alternative i is better than j divided by
the total Monte Carlo simulation iterations. For the seven DH technologies, their pairwise
winning indices are shown in Table 7.4. The pairwise winning indices of one alternative to
itself is zero. It can be found that coal-CHP is highly certain to dominate other alternatives,
but not the gas-HOB, which is the second best alternative in this study. In fact, gas-HOB is
even more certain to dominate other alternatives, however the pairwise winning index for
gas-HOB compared to coal-CHP is 46.90% (less than 50%), which means that coal-CHP is
more likely better than gas-HOB.
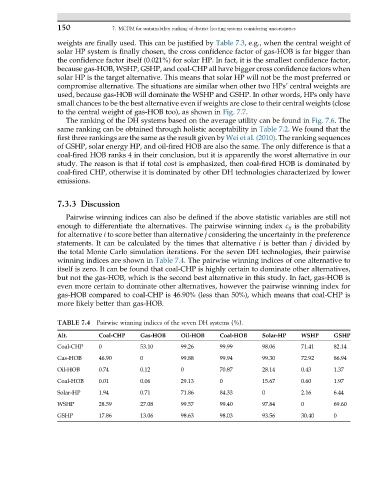
TABLE 7.4 Pairwise winning indices of the seven DH systems (%).
Alt. Coal-CHP Gas-HOB Oil-HOB Coal-HOB Solar-HP WSHP GSHP
Coal-CHP 0 53.10 99.26 99.99 98.06 71.41 82.14
Gas-HOB 46.90 0 99.88 99.94 99.30 72.92 86.94
Oil-HOB 0.74 0.12 0 70.87 28.14 0.43 1.37
Coal-HOB 0.01 0.06 29.13 0 15.67 0.60 1.97
Solar-HP 1.94 0.71 71.86 84.33 0 2.16 6.44
WSHP 28.59 27.08 99.57 99.40 97.84 0 69.60
GSHP 17.86 13.06 98.63 98.03 93.56 30.40 0