
Page 420 - Lindens Handbook of Batteries
P. 420
LiTHiUM PriMAry BATTerieS 14.85
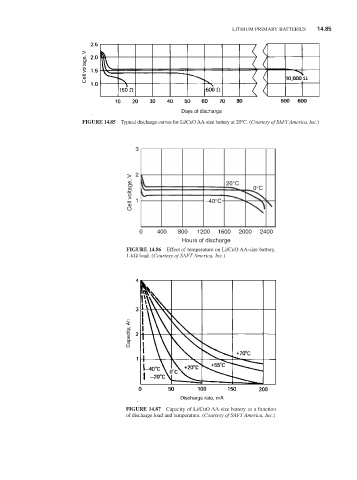
FIGURE 14.85 Typical discharge curves for Li/CuO AA-size battery at 20°C. (Courtesy of SAFT America, Inc.)
3
Cell voltage, V 2 1 –40°C 20°C 0°C
0 400 800 1200 1600 2000 2400
Hours of discharge
FIGURE 14.86 effect of temperature on Li/CuO AA-size battery,
1-kΩ load. (Courtesy of SAFT America, Inc.)
FIGURE 14.87 Capacity of Li/CuO AA-size battery as a function
of discharge load and temperature. (Courtesy of SAFT America, Inc.)