
Page 102 - Lindens Handbook of Batteries
P. 102
FACTORS AFFECTING BATTERY PERFORMANCE 3.21
Light load
Voltage Heavy
load
Very light load
Percent capacity discharged 100
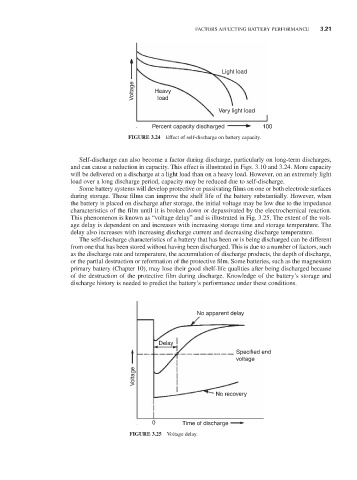
FIGURE 3.24 Effect of self-discharge on battery capacity.
Self-discharge can also become a factor during discharge, particularly on long-term discharges,
and can cause a reduction in capacity. This effect is illustrated in Figs. 3.10 and 3.24. More capacity
will be delivered on a discharge at a light load than on a heavy load. However, on an extremely light
load over a long discharge period, capacity may be reduced due to self-discharge.
Some battery systems will develop protective or passivating films on one or both electrode surfaces
during storage. These films can improve the shelf life of the battery substantially. However, when
the battery is placed on discharge after storage, the initial voltage may be low due to the impedance
characteristics of the film until it is broken down or depassivated by the electrochemical reaction.
This phenomenon is known as “voltage delay” and is illustrated in Fig. 3.25. The extent of the volt-
age delay is dependent on and increases with increasing storage time and storage temperature. The
delay also increases with increasing discharge current and decreasing discharge temperature.
The self-discharge characteristics of a battery that has been or is being discharged can be different
from one that has been stored without having been discharged. This is due to a number of factors, such
as the discharge rate and temperature, the accumulation of discharge products, the depth of discharge,
or the partial destruction or reformation of the protective film. Some batteries, such as the magnesium
primary battery (Chapter 10), may lose their good shelf-life qualities after being discharged because
of the destruction of the protective film during discharge. Knowledge of the battery’s storage and
discharge history is needed to predict the battery’s performance under these conditions.
No apparent delay
Delay
Specified end
voltage
Voltage
No recovery
0 Time of discharge
FIGURE 3.25 Voltage delay.