
Page 196 - Lindens Handbook of Batteries
P. 196
AN INTRODUCTION TO PRIMARY BATTERIES 8.9
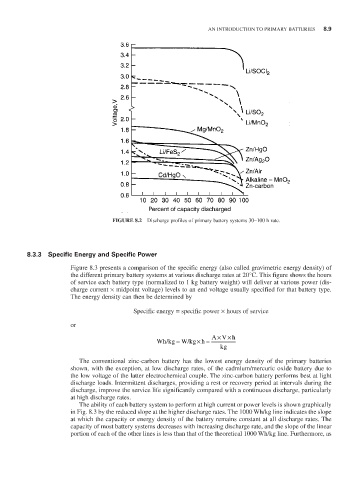
FIGURE 8.2 Discharge profiles of primary battery systems 30–100 h rate.
8.3.3 Specific Energy and Specific Power
Figure 8.3 presents a comparison of the specific energy (also called gravimetric energy density) of
the different primary battery systems at various discharge rates at 20°C. This figure shows the hours
of service each battery type (normalized to 1 kg battery weight) will deliver at various power (dis-
charge current × midpoint voltage) levels to an end voltage usually specified for that battery type.
The energy density can then be determined by
Specific energy = specific power × hours of service
or
×
×
=
×
Wh/kgW/kgh = AVh
kg
The conventional zinc-carbon battery has the lowest energy density of the primary batteries
shown, with the exception, at low discharge rates, of the cadmium/mercuric oxide battery due to
the low voltage of the latter electrochemical couple. The zinc-carbon battery performs best at light
discharge loads. Intermittent discharges, providing a rest or recovery period at intervals during the
discharge, improve the service life significantly compared with a continuous discharge, particularly
at high discharge rates.
The ability of each battery system to perform at high current or power levels is shown graphically
in Fig. 8.3 by the reduced slope at the higher discharge rates. The 1000 Wh/kg line indicates the slope
at which the capacity or energy density of the battery remains constant at all discharge rates. The
capacity of most battery systems decreases with increasing discharge rate, and the slope of the linear
portion of each of the other lines is less than that of the theoretical 1000 Wh/kg line. Furthermore, as