
Page 206 - MATLAB Recipes for Earth Sciences
P. 206
8.3 Importing, Processing and Exporting Images 201
scale arrays. The commands
imshow(unconform1), figure, imshow(unconform2)
display the result. It is easy to see the difference between the two images in
separate Figure Windows (Fig. 8.1 and 8.2). Let us now process the grayscale
image. First we compute a histogram of the distribution of intensity values.
imhist(unconform2)
A simple technique to enhance the contrast of such an image is to transform
this histogram in order to obtain an equal distribution of grayscales:
unconform3 = histeq(unconform2);
We can view the difference again using
imshow(unconform2), figure, imshow(unconform3)
and save the results in a new fi le
imwrite(unconform3,'unconform3.jpg')
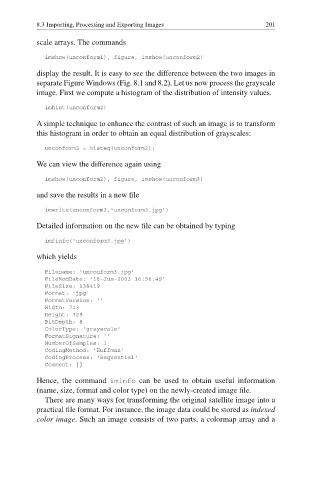
Detailed information on the new file can be obtained by typing
imfinfo('unconform3.jpg')
which yields
Filename: 'unconform3.jpg'
FileModDate: '18-Jun-2003 16:56:49'
FileSize: 138419
Format: 'jpg'
FormatVersion: ''
Width: 713
Height: 729
BitDepth: 8
ColorType: 'grayscale'
FormatSignature: ''
NumberOfSamples: 1
CodingMethod: 'Huffman'
CodingProcess: 'Sequential'
Comment: {}
Hence, the command iminfo can be used to obtain useful information
(name, size, format and color type) on the newly-created image fi le.
There are many ways for transforming the original satellite image into a
practical file format. For instance, the image data could be stored as indexed
color image. Such an image consists of two parts, a colormap array and a