
Page 106 - Machine Learning for Subsurface Characterization
P. 106
88 Machine learning for subsurface characterization
Comparison of NMR porosity Comparison of T 2,gm
0.12 1.25
0.1
1.2
Predicted values 0.06 Predicted values 1.15
0.08
1.1
0.04
1.05
0.02
0 1
0 0.02 0.04 0.06 0.08 0.1 0.12 1 1.05 1.1 1.15 1.2 1.25
(A) Original values (B) Original values
Comparison of SDR term
0.12
0.1
Predicted values 0.06
0.08
0.04
0.02
0
0 0.02 0.04 0.06 0.08 0.1 0.12
(C) Original values
2
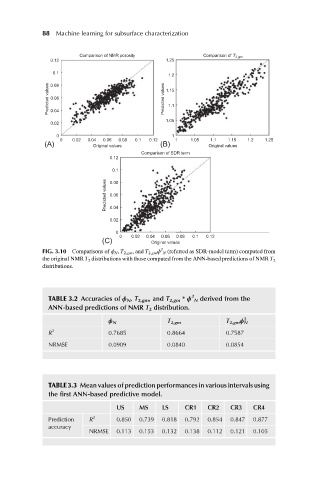
FIG. 3.10 Comparisons of ϕ N , T 2,gm , and T 2,gm ϕ N (referred as SDR-model term) computed from
the original NMR T 2 distributions with those computed from the ANN-based predictions of NMR T 2
distributions.
TABLE 3.2 Accuracies of ϕ N , T 2,gm , and T 2,gm ∗ ϕ N derived from the
2
ANN-based predictions of NMR T 2 distribution.
2
T 2,gm ϕ N
ϕ N
T 2,gm
R 2 0.7685 0.8664 0.7587
NRMSE 0.0909 0.0840 0.0854
TABLE 3.3 Mean values of prediction performances in various intervals using
the first ANN-based predictive model.
US MS LS CR1 CR2 CR3 CR4
Prediction R 2 0.850 0.739 0.818 0.792 0.854 0.847 0.877
accuracy
NRMSE 0.113 0.153 0.132 0.138 0.112 0.121 0.105