
Page 104 - Machine Learning for Subsurface Characterization
P. 104
86 Machine learning for subsurface characterization
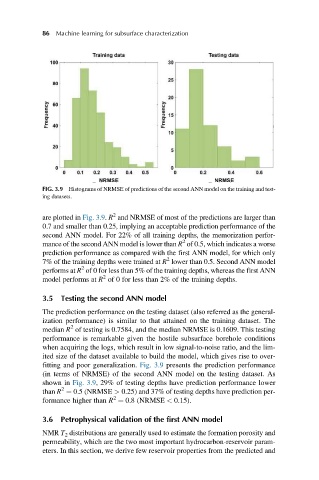
FIG. 3.9 Histograms of NRMSE of predictions of the second ANN model on the training and test-
ing datasets.
2
are plotted in Fig. 3.9. R and NRMSE of most of the predictions are larger than
0.7 and smaller than 0.25, implying an acceptable prediction performance of the
second ANN model. For 22% of all training depths, the memorization perfor-
2
mance of the second ANN model is lower than R of 0.5, which indicates a worse
prediction performance as compared with the first ANN model, for which only
2
7% of the training depths were trained at R lower than 0.5. Second ANN model
2
performs at R of 0 for less than 5% of the training depths, whereas the first ANN
2
model performs at R of 0 for less than 2% of the training depths.
3.5 Testing the second ANN model
The prediction performance on the testing dataset (also referred as the general-
ization performance) is similar to that attained on the training dataset. The
2
median R of testing is 0.7584, and the median NRMSE is 0.1609. This testing
performance is remarkable given the hostile subsurface borehole conditions
when acquiring the logs, which result in low signal-to-noise ratio, and the lim-
ited size of the dataset available to build the model, which gives rise to over-
fitting and poor generalization. Fig. 3.9 presents the prediction performance
(in terms of NRMSE) of the second ANN model on the testing dataset. As
shown in Fig. 3.9, 29% of testing depths have prediction performance lower
2
than R ¼ 0.5 (NRMSE > 0.25) and 37% of testing depths have prediction per-
2
formance higher than R ¼ 0.8 (NRMSE < 0.15).
3.6 Petrophysical validation of the first ANN model
NMR T 2 distributions are generally used to estimate the formation porosity and
permeability, which are the two most important hydrocarbon-reservoir param-
eters. In this section, we derive few reservoir properties from the predicted and