
Page 100 - Machine Learning for Subsurface Characterization
P. 100
Shallow neural networks and classification methods Chapter 3 83
FIG. 3.6 Histograms of NRMSE of predictions of the first ANN model on the training (left) and
testing (right) datasets.
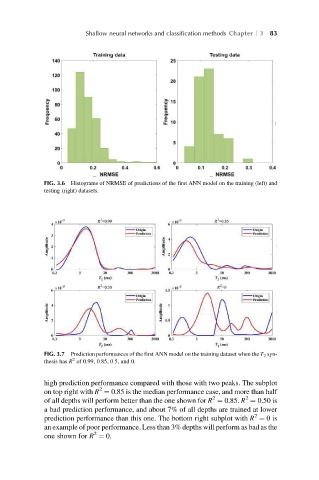
FIG. 3.7 Prediction performances of the first ANN model on the training dataset when the T 2 syn-
2
thesis has R of 0.99, 0.85, 0.5, and 0.
high prediction performance compared with those with two peaks. The subplot
2
on top right with R ¼ 0.85 is the median performance case, and more than half
2
2
of all depths will perform better than the one shown for R ¼ 0.85. R ¼ 0.50 is
a bad prediction performance, and about 7% of all depths are trained at lower
2
prediction performance than this one. The bottom right subplot with R ¼ 0is
an example of poor performance. Less than 3% depths will perform as bad as the
2
one shown for R ¼ 0.