
Page 203 - Machine Learning for Subsurface Characterization
P. 203
Dimensionality reduction and clustering techniques Chapter 6 173
When the MMP is higher than the reservoir pressure, a portion of free oil cannot
achieve miscibility during the injection, which is possible for free oil residing in
larger pores. High MMP reduces the displacement efficiency of light-
hydrocarbon injection. The amount of oil that can achieve miscibility under
reservoir condition is a direct measure of displacement efficiency.
To estimate the volume fraction of free oil that can achieve miscibility in the
presence of pore-confinement effect, the pore size distribution of a formation is
first calculated from the measured NMR T2 distribution. The T2 relaxation
captured in the NMR measurement (Fig. 6.5, Track 1) is a sum of bulk fluid
relaxation, molecular relaxation, and surface relaxation. T2 distribution
represents pore size distribution because the surface relaxation is
proportional to the surface-to-volume ratio and surface relaxivity. In tight
formation, where pore size is small and the pore is filled with light oil, the
bulk relaxation and molecular diffusion effect can be neglected [34, 35].
Based on this assumption the T2 response is associated with pore diameter
by using the surface relaxivity expressed as
1 6
¼ ρ (6.6)
T 2, Surface d
where T 2, surface is the surface relaxation in ms, ρ is surface relaxivity in nm/ms,
and d is pore body diameter in nanometers.
The middle shale has larger pore throat and pore diameter than the upper and
lower shales. In the absence of SEM image, we refer to the literature and the
maximum throat size in the middle section is assumed to be around 100 nm
[36], and the maximum pore body size in the middle section is assumed to
be around 1000 nm [37]. Similarly, the pore throat size in upper and lower
sections is assumed to be around 25 nm [14]. We assume that the body size-
to-throat size ratio in the upper and lower shales is equal to that in the
middle section. From the NMR T2 distribution log, the maximum T2 value
of upper and lower shale sections is 30 ms, and that in the middle section is
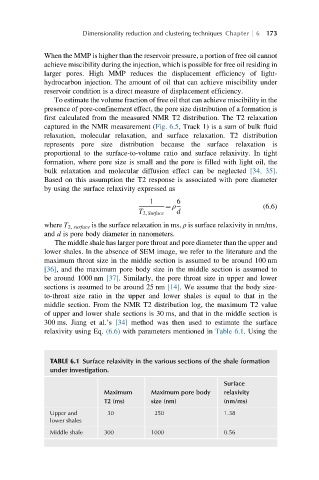
300 ms. Jiang et al.’s [34] method was then used to estimate the surface
relaxivity using Eq. (6.6) with parameters mentioned in Table 6.1. Using the
TABLE 6.1 Surface relaxivity in the various sections of the shale formation
under investigation.
Surface
Maximum Maximum pore body relaxivity
T2 (ms) size (nm) (nm/ms)
Upper and 30 250 1.38
lower shales
Middle shale 300 1000 0.56