
Page 204 - Machine Learning for Subsurface Characterization
P. 204
174 Machine learning for subsurface characterization
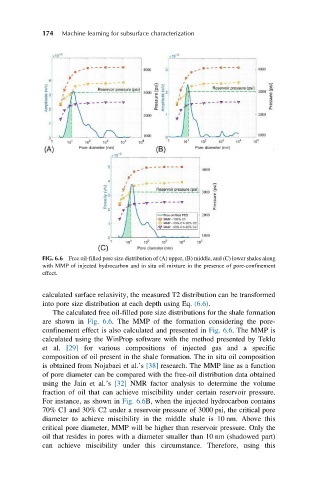
FIG. 6.6 Free oil-filled pore size distribution of (A) upper, (B) middle, and (C) lower shales along
with MMP of injected hydrocarbon and in situ oil mixture in the presence of pore-confinement
effect.
calculated surface relaxivity, the measured T2 distribution can be transformed
into pore size distribution at each depth using Eq. (6.6).
The calculated free oil-filled pore size distributions for the shale formation
are shown in Fig. 6.6. The MMP of the formation considering the pore-
confinement effect is also calculated and presented in Fig. 6.6. The MMP is
calculated using the WinProp software with the method presented by Teklu
et al. [29] for various compositions of injected gas and a specific
composition of oil present in the shale formation. The in situ oil composition
is obtained from Nojabaei et al.’s [38] research. The MMP line as a function
of pore diameter can be compared with the free-oil distribution data obtained
using the Jain et al.’s [32] NMR factor analysis to determine the volume
fraction of oil that can achieve miscibility under certain reservoir pressure.
For instance, as shown in Fig. 6.6B, when the injected hydrocarbon contains
70% C1 and 30% C2 under a reservoir pressure of 3000 psi, the critical pore
diameter to achieve miscibility in the middle shale is 10 nm. Above this
critical pore diameter, MMP will be higher than reservoir pressure. Only the
oil that resides in pores with a diameter smaller than 10 nm (shadowed part)
can achieve miscibility under this circumstance. Therefore, using this