
Page 33 - Machine Learning for Subsurface Characterization
P. 33
18 Machine learning for subsurface characterization
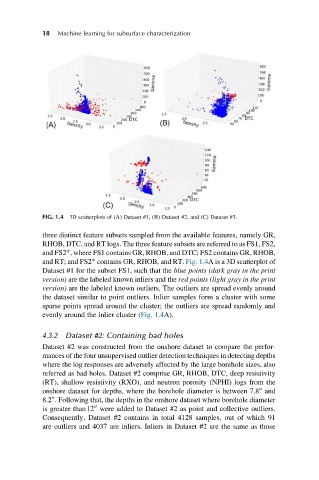
FIG. 1.4 3D scatterplots of (A) Dataset #1, (B) Dataset #2, and (C) Dataset #3.
three distinct feature subsets sampled from the available features, namely GR,
RHOB, DTC, and RT logs. The three feature subsets are referred to as FS1, FS2,
and FS2*, where FS1 contains GR, RHOB, and DTC; FS2 contains GR, RHOB,
and RT; and FS2* contains GR, RHOB, and RT. Fig. 1.4A is a 3D scatterplot of
Dataset #1 for the subset FS1, such that the blue points (dark gray in the print
version) are the labeled known inliers and the red points (light gray in the print
version) are the labeled known outliers. The outliers are spread evenly around
the dataset similar to point outliers. Inlier samples form a cluster with some
sparse points spread around the cluster; the outliers are spread randomly and
evenly around the inlier cluster (Fig. 1.4A).
4.3.2 Dataset #2: Containing bad holes
Dataset #2 was constructed from the onshore dataset to compare the perfor-
mances of the four unsupervised outlier detection techniques in detecting depths
where the log responses are adversely affected by the large borehole sizes, also
referred as bad holes. Dataset #2 comprise GR, RHOB, DTC, deep resistivity
(RT), shallow resistivity (RXO), and neutron porosity (NPHI) logs from the
00
onshore dataset for depths, where the borehole diameter is between 7.8 and
00
8.2 . Following that, the depths in the onshore dataset where borehole diameter
00
is greater than12 were added to Dataset #2 as point and collective outliers.
Consequently, Dataset #2 contains in total 4128 samples, out of which 91
are outliers and 4037 are inliers. Inliers in Dataset #2 are the same as those