
Page 57 - Machine Learning for Subsurface Characterization
P. 57
Characterization of fracture-induced geomechanical alterations Chapter 2 43
Receiver Transmitter
transducers transducers
Receiver
1 1 Direction of transducers Sample Transmitter
transducer cut off transducers Sample
2 2 polarization 1 cut off
1
3 3
2
2
4
6 in. 4 3
3
Direction of
5 5 4 transducer
4 polarization
6 in.
Scanning 5 direction 5
6 6 Scanning
direction
direction
direction
7 7 Scanning 6 6 Scanning
7
7
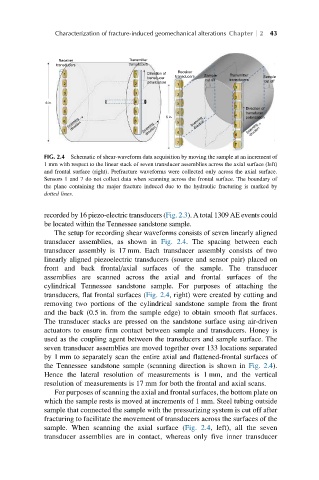
FIG. 2.4 Schematic of shear-waveform data acquisition by moving the sample at an increment of
1 mm with respect to the linear stack of seven transducer assemblies across the axial surface (left)
and frontal surface (right). Prefracture waveforms were collected only across the axial surface.
Sensors 1 and 7 do not collect data when scanning across the frontal surface. The boundary of
the plane containing the major fracture induced due to the hydraulic fracturing is marked by
dotted lines.
recorded by 16 piezo-electric transducers (Fig. 2.3). A total 1309 AE events could
be located within the Tennessee sandstone sample.
The setup for recording shear waveforms consists of seven linearly aligned
transducer assemblies, as shown in Fig. 2.4. The spacing between each
transducer assembly is 17 mm. Each transducer assembly consists of two
linearly aligned piezoelectric transducers (source and sensor pair) placed on
front and back frontal/axial surfaces of the sample. The transducer
assemblies are scanned across the axial and frontal surfaces of the
cylindrical Tennessee sandstone sample. For purposes of attaching the
transducers, flat frontal surfaces (Fig. 2.4, right) were created by cutting and
removing two portions of the cylindrical sandstone sample from the front
and the back (0.5 in. from the sample edge) to obtain smooth flat surfaces.
The transducer stacks are pressed on the sandstone surface using air-driven
actuators to ensure firm contact between sample and transducers. Honey is
used as the coupling agent between the transducers and sample surface. The
seven transducer assemblies are moved together over 133 locations separated
by 1 mm to separately scan the entire axial and flattened-frontal surfaces of
the Tennessee sandstone sample (scanning direction is shown in Fig. 2.4).
Hence the lateral resolution of measurements is 1 mm, and the vertical
resolution of measurements is 17 mm for both the frontal and axial scans.
For purposes of scanning the axial and frontal surfaces, the bottom plate on
which the sample rests is moved at increments of 1 mm. Steel tubing outside
sample that connected the sample with the pressurizing system is cut off after
fracturing to facilitate the movement of transducers across the surfaces of the
sample. When scanning the axial surface (Fig. 2.4, left), all the seven
transducer assemblies are in contact, whereas only five inner transducer