
Page 56 - Machine Learning for Subsurface Characterization
P. 56
42 Machine learning for subsurface characterization
reported by Bhoumick [10]. The hydraulic fracturing, acoustic emissions and
shear-waveform measurements were performed on a cylindrical sample of Ten-
nessee sandstone that has a diameter of 152 mm and length of 154 mm. The data
acquisition and processing workflow is outlined in Fig. 2.2. The experiment
begins with circumferential velocity analysis (CVA), which is the measurement
of P-wave velocity across the circumference of the sample at different azimuths.
This measurement determines the P-wave velocity anisotropy and hence the
direction of fabric in the horizontal plane perpendicular to axis of the cylinder
[10]. The maximum azimuthal variation in P-wave velocity was 2.7 %, and the
mean P-wave velocity determined from CVA was 3.26 km/s.
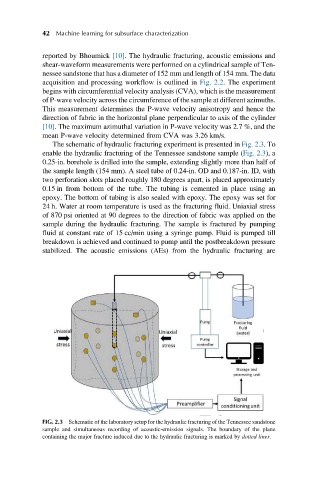
The schematic of hydraulic fracturing experiment is presented in Fig. 2.3.To
enable the hydraulic fracturing of the Tennessee sandstone sample (Fig. 2.3), a
0.25-in. borehole is drilled into the sample, extending slightly more than half of
the sample length (154 mm). A steel tube of 0.24-in. OD and 0.187-in. ID, with
two perforation slots placed roughly 180 degrees apart, is placed approximately
0.15 in from bottom of the tube. The tubing is cemented in place using an
epoxy. The bottom of tubing is also sealed with epoxy. The epoxy was set for
24 h. Water at room temperature is used as the fracturing fluid. Uniaxial stress
of 870 psi oriented at 90 degrees to the direction of fabric was applied on the
sample during the hydraulic fracturing. The sample is fractured by pumping
fluid at constant rate of 15 cc/min using a syringe pump. Fluid is pumped till
breakdown is achieved and continued to pump until the postbreakdown pressure
stabilized. The acoustic emissions (AEs) from the hydraulic fracturing are
FIG. 2.3 Schematic of the laboratory setup for the hydraulic fracturing of the Tennessee sandstone
sample and simultaneous recording of acoustic-emission signals. The boundary of the plane
containing the major fracture induced due to the hydraulic fracturing is marked by dotted lines.