
Page 51 - Machine Learning for Subsurface Characterization
P. 51
36 Machine learning for subsurface characterization
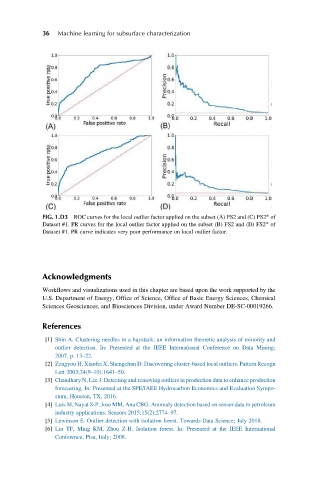
FIG. 1.D3 ROC curves for the local outlier factor applied on the subset (A) FS2 and (C) FS2* of
Dataset #1. PR curves for the local outlier factor applied on the subset (B) FS2 and (D) FS2* of
Dataset #1. PR curve indicates very poor performance on local outlier factor.
Acknowledgments
Workflows and visualizations used in this chapter are based upon the work supported by the
U.S. Department of Energy, Office of Science, Office of Basic Energy Sciences, Chemical
Sciences Geosciences, and Biosciences Division, under Award Number DE-SC-00019266.
References
[1] Shin A. Clustering needles in a haystack: an information theoretic analysis of minority and
outlier detection. In: Presented at the IEEE International Conference on Data Mining;
2007. p. 13–22.
[2] Zengyou H, Xiaofei X, Shengchun D. Discovering cluster-based local outliers. Pattern Recogn
Lett 2003;24(9–10):1641–50.
[3] Chaudhary N, Lee J. Detecting and removing outliers in production data to enhance production
forecasting. In: Presented at the SPE/IAEE Hydrocarbon Economics and Evaluation Sympo-
sium, Houston, TX, 2016.
[4] Luis M, Nayat S-P, Jose MM, Ana CBG. Anomaly detection based on sensor data in petroleum
industry applications. Sensors 2015;15(2):2774–97.
[5] Lewinson E. Outlier detection with isolation forest. Towards Data Science; July 2018.
[6] Liu TF, Ming KM, Zhou Z-H. Isolation forest. In: Presented at the IEEE International
Conference, Pisa, Italy; 2008.