
Page 46 - Machine Learning for Subsurface Characterization
P. 46
Unsupervised outlier detection techniques Chapter 1 31
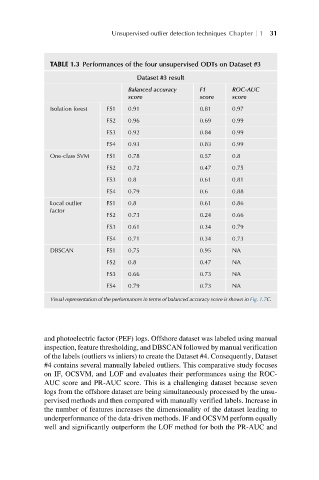
TABLE 1.3 Performances of the four unsupervised ODTs on Dataset #3
Dataset #3 result
Balanced accuracy F1 ROC-AUC
score score score
Isolation forest FS1 0.91 0.81 0.97
FS2 0.96 0.69 0.99
FS3 0.92 0.84 0.99
FS4 0.93 0.83 0.99
One-class SVM FS1 0.78 0.57 0.8
FS2 0.72 0.47 0.75
FS3 0.8 0.61 0.81
FS4 0.79 0.6 0.88
Local outlier FS1 0.8 0.61 0.86
factor
FS2 0.73 0.24 0.66
FS3 0.61 0.34 0.79
FS4 0.71 0.34 0.73
DBSCAN FS1 0.75 0.95 NA
FS2 0.8 0.47 NA
FS3 0.66 0.73 NA
FS4 0.79 0.73 NA
Visual representation of the performances in terms of balanced accuracy score is shown in Fig. 1.7C.
and photoelectric factor (PEF) logs. Offshore dataset was labeled using manual
inspection, feature thresholding, and DBSCAN followed by manual verification
of the labels (outliers vs inliers) to create the Dataset #4. Consequently, Dataset
#4 contains several manually labeled outliers. This comparative study focuses
on IF, OCSVM, and LOF and evaluates their performances using the ROC-
AUC score and PR-AUC score. This is a challenging dataset because seven
logs from the offshore dataset are being simultaneously processed by the unsu-
pervised methods and then compared with manually verified labels. Increase in
the number of features increases the dimensionality of the dataset leading to
underperformance of the data-driven methods. IF and OCSVM perform equally
well and significantly outperform the LOF method for both the PR-AUC and