
Page 42 - Machine Learning for Subsurface Characterization
P. 42
Unsupervised outlier detection techniques Chapter 1 27
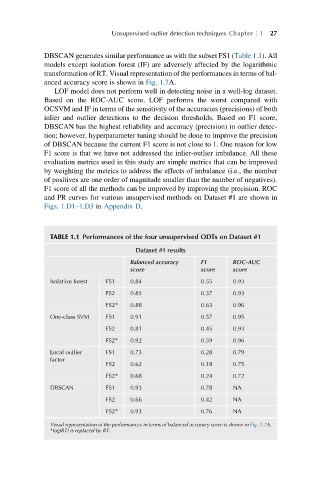
DBSCAN generates similar performance as with the subset FS1 (Table 1.1). All
models except isolation forest (IF) are adversely affected by the logarithmic
transformation of RT. Visual representation of the performances in terms of bal-
anced accuracy score is shown in Fig. 1.7A.
LOF model does not perform well in detecting noise in a well-log dataset.
Based on the ROC-AUC score, LOF performs the worst compared with
OCSVM and IF in terms of the sensitivity of the accuracies (precisions) of both
inlier and outlier detections to the decision thresholds. Based on F1 score,
DBSCAN has the highest reliability and accuracy (precision) in outlier detec-
tion; however, hyperparameter tuning should be done to improve the precision
of DBSCAN because the current F1 score is not close to 1. One reason for low
F1 score is that we have not addressed the inlier-outlier imbalance. All these
evaluation metrics used in this study are simple metrics that can be improved
by weighting the metrics to address the effects of imbalance (i.e., the number
of positives are one order of magnitude smaller than the number of negatives).
F1 score of all the methods can be improved by improving the precision. ROC
and PR curves for various unsupervised methods on Dataset #1 are shown in
Figs. 1.D1–1.D3 in Appendix D.
TABLE 1.1 Performances of the four unsupervised ODTs on Dataset #1
Dataset #1 results
Balanced accuracy F1 ROC-AUC
score score score
Isolation forest FS1 0.84 0.55 0.93
FS2 0.85 0.37 0.93
FS2* 0.88 0.63 0.96
One-class SVM FS1 0.91 0.57 0.95
FS2 0.81 0.45 0.93
FS2* 0.92 0.59 0.96
Local outlier FS1 0.73 0.28 0.79
factor
FS2 0.62 0.18 0.75
FS2* 0.68 0.24 0.72
DBSCAN FS1 0.93 0.78 NA
FS2 0.66 0.42 NA
FS2* 0.93 0.76 NA
Visual representation of the performances in terms of balanced accuracy score is shown in Fig. 1.7A.
*log(RT) is replaced by RT.