
Page 40 - Machine Learning for Subsurface Characterization
P. 40
Unsupervised outlier detection techniques Chapter 1 25
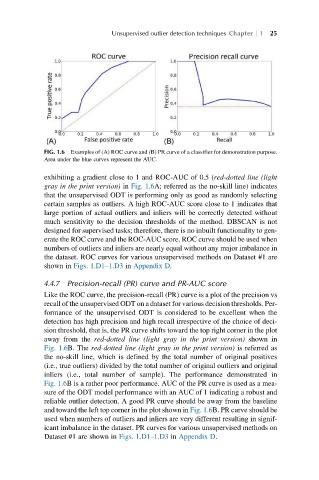
FIG. 1.6 Examples of (A) ROC curve and (B) PR curve of a classifier for demonstration purpose.
Area under the blue curves represent the AUC.
exhibiting a gradient close to 1 and ROC-AUC of 0.5 (red-dotted line (light
gray in the print version) in Fig. 1.6A; referred as the no-skill line) indicates
that the unsupervised ODT is performing only as good as randomly selecting
certain samples as outliers. A high ROC-AUC score close to 1 indicates that
large portion of actual outliers and inliers will be correctly detected without
much sensitivity to the decision thresholds of the method. DBSCAN is not
designed for supervised tasks; therefore, there is no inbuilt functionality to gen-
erate the ROC curve and the ROC-AUC score. ROC curve should be used when
numbers of outliers and inliers are nearly equal without any major imbalance in
the dataset. ROC curves for various unsupervised methods on Dataset #1 are
shown in Figs. 1.D1–1.D3 in Appendix D.
4.4.7 Precision-recall (PR) curve and PR-AUC score
Like the ROC curve, the precision-recall (PR) curve is a plot of the precision vs
recall of the unsupervised ODT on a dataset for various decision thresholds. Per-
formance of the unsupervised ODT is considered to be excellent when the
detection has high precision and high recall irrespective of the choice of deci-
sion threshold, that is, the PR curve shifts toward the top right corner in the plot
away from the red-dotted line (light gray in the print version) shown in
Fig. 1.6B. The red-dotted line (light gray in the print version) is referred as
the no-skill line, which is defined by the total number of original positives
(i.e., true outliers) divided by the total number of original outliers and original
inliers (i.e., total number of sample). The performance demonstrated in
Fig. 1.6B is a rather poor performance. AUC of the PR curve is used as a mea-
sure of the ODT model performance with an AUC of 1 indicating a robust and
reliable outlier detection. A good PR curve should be away from the baseline
and toward the left top corner in the plot shown in Fig. 1.6B. PR curve should be
used when numbers of outliers and inliers are very different resulting in signif-
icant imbalance in the dataset. PR curves for various unsupervised methods on
Dataset #1 are shown in Figs. 1.D1–1.D3 in Appendix D.