
Page 49 - Machine Learning for Subsurface Characterization
P. 49
34 Machine learning for subsurface characterization
Appendix B Confusion matrix to quantify the inlier and outlier
detections by the unsupervised ODTs
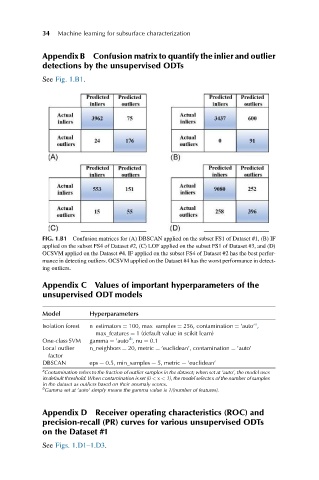
See Fig. 1.B1.
FIG. 1.B1 Confusion matrices for (A) DBSCAN applied on the subset FS1 of Dataset #1, (B) IF
applied on the subset FS4 of Dataset #2, (C) LOF applied on the subset FS1 of Dataset #3, and (D)
OCSVM applied on the Dataset #4. IF applied on the subset FS4 of Dataset #2 has the best perfor-
mance in detecting outliers. OCSVM applied on the Dataset #4 has the worst performance in detect-
ing outliers.
Appendix C Values of important hyperparameters of the
unsupervised ODT models
Model Hyperparameters
a
Isolation forest n_estimators ¼ 100, max_samples ¼ 256, contamination ¼ ’auto’ ,
max_features ¼ 1 (default value in scikit learn)
b
One-class SVM gamma ¼ ’auto’ ,nu ¼ 0.1
Local outlier n_neighbors ¼ 20, metric ¼ ’euclidean’, contamination ¼ ’auto’
factor
DBSCAN eps ¼ 0.5, min_samples ¼ 5, metric ¼ ’euclidean’
a
Contamination refers to the fraction of outlier samples in the dataset; when set at ’auto’, the model uses
its default threshold. When contamination is set (0 < x < 1), the model selects x of the number of samples
in the dataset as outliers based on their anomaly scores.
b
Gamma set at ’auto’ simply means the gamma value is 1/(number of features).
Appendix D Receiver operating characteristics (ROC) and
precision-recall (PR) curves for various unsupervised ODTs
on the Dataset #1
See Figs. 1.D1–1.D3.