
Page 50 - Machine Learning for Subsurface Characterization
P. 50
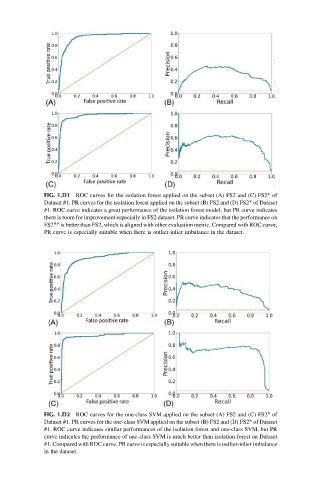
FIG. 1.D1 ROC curves for the isolation forest applied on the subset (A) FS2 and (C) FS2* of
             Dataset #1. PR curves for the isolation forest applied on the subset (B) FS2 and (D) FS2* of Dataset
             #1. ROC curve indicates a great performance of the isolation forest model, but PR curve indicates
             there is room for improvement especially in FS2 dataset. PR curve indicates that the performance on
             FS2** is better than FS2, which is aligned with other evaluation metric. Compared with ROC curve,
             PR curve is especially suitable when there is outlier-inlier imbalance in the dataset.


             FIG. 1.D2 ROC curves for the one-class SVM applied on the subset (A) FS2 and (C) FS2* of
             Dataset #1. PR curves for the one-class SVM applied on the subset (B) FS2 and (D) FS2* of Dataset
             #1. ROC curve indicates similar performances of the isolation forest and one-class SVM, but PR
             curve indicates the performance of one-class SVM is much better than isolation forest on Dataset
             #1. Compared with ROC curve, PR curve is especially suitable when there is outlier-inlier imbalance
             in the dataset.