
Page 84 - Machine Learning for Subsurface Characterization
P. 84
70 Machine learning for subsurface characterization
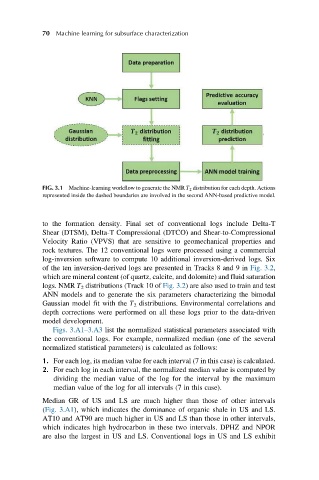
FIG. 3.1 Machine-learning workflow to generate the NMR T 2 distribution for each depth. Actions
represented inside the dashed boundaries are involved in the second ANN-based predictive model.
to the formation density. Final set of conventional logs include Delta-T
Shear (DTSM), Delta-T Compressional (DTCO) and Shear-to-Compressional
Velocity Ratio (VPVS) that are sensitive to geomechanical properties and
rock textures. The 12 conventional logs were processed using a commercial
log-inversion software to compute 10 additional inversion-derived logs. Six
of the ten inversion-derived logs are presented in Tracks 8 and 9 in Fig. 3.2,
which are mineral content (of quartz, calcite, and dolomite) and fluid saturation
logs. NMR T 2 distributions (Track 10 of Fig. 3.2) are also used to train and test
ANN models and to generate the six parameters characterizing the bimodal
Gaussian model fit with the T 2 distributions. Environmental correlations and
depth corrections were performed on all these logs prior to the data-driven
model development.
Figs. 3.A1–3.A3 list the normalized statistical parameters associated with
the conventional logs. For example, normalized median (one of the several
normalized statistical parameters) is calculated as follows:
1. For each log, its median value for each interval (7 in this case) is calculated.
2. For each log in each interval, the normalized median value is computed by
dividing the median value of the log for the interval by the maximum
median value of the log for all intervals (7 in this case).
Median GR of US and LS are much higher than those of other intervals
(Fig. 3.A1), which indicates the dominance of organic shale in US and LS.
AT10 and AT90 are much higher in US and LS than those in other intervals,
which indicates high hydrocarbon in these two intervals. DPHZ and NPOR
are also the largest in US and LS. Conventional logs in US and LS exhibit