
Page 259 -
P. 259
258 Part Two Information Technology Infrastructure
data in different ways using multiple dimensions. Each aspect of information—
product, pricing, cost, region, or time period—represents a different dimension.
So, a product manager could use a multidimensional data analysis tool to learn
how many washers were sold in the East in June, how that compares with the
previous month and the previous June, and how it compares with the sales
forecast. OLAP enables users to obtain online answers to ad hoc questions such
as these in a fairly rapid amount of time, even when the data are stored in very
large databases, such as sales figures for multiple years.
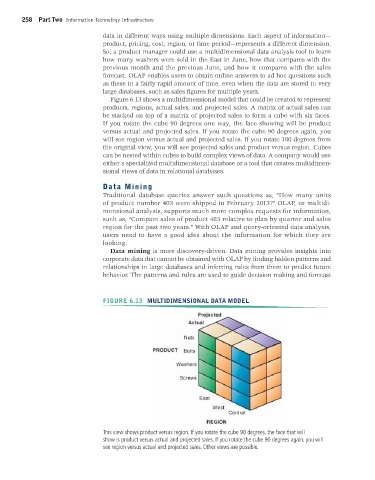
Figure 6.13 shows a multidimensional model that could be created to represent
products, regions, actual sales, and projected sales. A matrix of actual sales can
be stacked on top of a matrix of projected sales to form a cube with six faces.
If you rotate the cube 90 degrees one way, the face showing will be product
versus actual and projected sales. If you rotate the cube 90 degrees again, you
will see region versus actual and projected sales. If you rotate 180 degrees from
the original view, you will see projected sales and product versus region. Cubes
can be nested within cubes to build complex views of data. A company would use
either a specialized multidimensional database or a tool that creates multidimen-
sional views of data in relational databases.
Data Mining
Traditional database queries answer such questions as, “How many units
of product number 403 were shipped in February 2013?” OLAP, or multidi-
mensional analysis, supports much more complex requests for information,
such as, “Compare sales of product 403 relative to plan by quarter and sales
region for the past two years.” With OLAP and query-oriented data analysis,
users need to have a good idea about the information for which they are
looking.
Data mining is more discovery-driven. Data mining provides insights into
corporate data that cannot be obtained with OLAP by finding hidden patterns and
relationships in large databases and inferring rules from them to predict future
behavior. The patterns and rules are used to guide decision making and forecast
FIGURE 6.13 MULTIDIMENSIONAL DATA MODEL
This view shows product versus region. If you rotate the cube 90 degrees, the face that will
show is product versus actual and projected sales. If you rotate the cube 90 degrees again, you will
see region versus actual and projected sales. Other views are possible.
MIS_13_Ch_06 Global.indd 258 1/17/2013 2:27:43 PM