
Page 100 - Managing Global Warming
P. 100
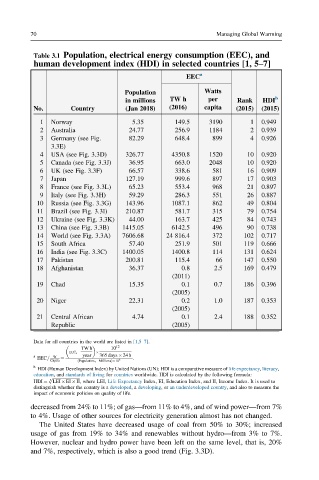
70                                                Managing Global Warming


          Table 3.1 Population, electrical energy consumption (EEC), and
          human development index (HDI) in selected countries [1, 5–7]
                                                       a
                                                   EEC
                                                        Watts
                                   Population
                                                                           b
                                               TW h      per
                                   in millions                   Rank   HDI
                                               (2016)   capita
          No.       Country        (Jan 2018)                    (2015)  (2015)
            1  Norway                5.35       149.5     3190       1  0.949
            2  Australia            24.77       256.9     1184       2  0.939
            3  Germany (see Fig.    82.29       648.4     899        4  0.926
               3.3E)
            4  USA (see Fig. 3.3D)  326.77     4350.8     1520      10  0.920
            5  Canada (see Fig. 3.3J)  36.95    663.0     2048      10  0.920
            6  UK (see Fig. 3.3F)   66.57       338.6     581       16  0.909
            7  Japan               127.19       999.6     897       17  0.903
            8  France (see Fig. 3.3L)  65.23    553.4     968       21  0.897
            9  Italy (see Fig. 3.3H)  59.29     286.3     551       26  0.887
           10  Russia (see Fig. 3.3G)  143.96  1087.1     862       49  0.804
           11  Brazil (see Fig. 3.3I)  210.87   581.7     315       79  0.754
           12  Ukraine (see Fig. 3.3K)  44.00   163.7     425       84  0.743
           13  China (see Fig. 3.3B)  1415.05  6142.5     496       90  0.738
           14  World (see Fig. 3.3A)  7606.68  24 816.4   372      102  0.717
           15  South Africa         57.40       251.9     501      119  0.666
           16  India (see Fig. 3.3C)  1400.05  1400.8     114      131  0.624
           17  Pakistan            200.81       115.4      66      147  0.550
           18  Afghanistan          36.37         0.8      2.5     169  0.479
                                                (2011)
           19  Chad                 15.35         0.1      0.7     186  0.396
                                                (2005)
           20  Niger                22.31         0.2      1.0     187  0.353
                                                (2005)
           21  Central African       4.74         0.1      2.4     188  0.352
               Republic                         (2005)

          Data for all countries in the world are listed in [1,5–7].
                                12
                       TW h    10
                    EEC,
          a  EEC=  W   year  365 days 24 h .
               Capita  ¼  ð Population, MillionsÞ 10 6
          b
           HDI (Human Development Index) by United Nations (UN); HDI is a comparative measure of life expectancy, literacy,
          education, and standards of living for countries worldwide. HDI is calculated by the following formula:
              p ffiffiffiffiffiffiffiffiffiffiffiffiffiffiffiffiffiffiffiffiffiffiffiffiffiffi
          HDI ¼ LEI EI II, where LEI, Life Expectancy Index, EI, Education Index, and II, Income Index. It is used to
              3
          distinguish whether the country is a developed,a developing,or an underdeveloped country, and also to measure the
          impact of economic policies on quality of life.
         decreased from 24% to 11%; of gas—from 11% to 4%, and of wind power—from 7%
         to 4%. Usage of other sources for electricity generation almost has not changed.
            The United States have decreased usage of coal from 50% to 30%; increased
         usage of gas from 19% to 34% and renewables without hydro—from 3% to 7%.
         However, nuclear and hydro power have been left on the same level, that is, 20%
         and 7%, respectively, which is also a good trend (Fig. 3.3D).