
Page 101 - Managing Global Warming
P. 101
1.0
1.0 Norway Very high HDI
Very high HDI Australia USA Canada 0.9 High HDI
Medium HDI
High HDI
0.9 Medium HDI Argentina UK Low HDI
Low HDI Iceland 0.8
0.8 Russia
Sri Lanka Cuba Ukraine 0.7
Tonga
HDI value 0.7 Cabo Verde Bhutan HDI value 0.6
China
Samoa
South Africa
Timor - Leste
0.6
Nepal Pakistan Syria 0.5
India
Rwanda
0.5 Swaziland 0.4
Mozambique HDI = 0.2775 + 0.0846ln(EEC)
0.4 Chad Congo 0.3 Accuracy ± 20%
Niger
0.3 0.2
1 10 100 1000 10,000 1 10 100 1000 10,000
(A) Energy consumption (W/Capita) (B) Energy consumption (W/Capita)
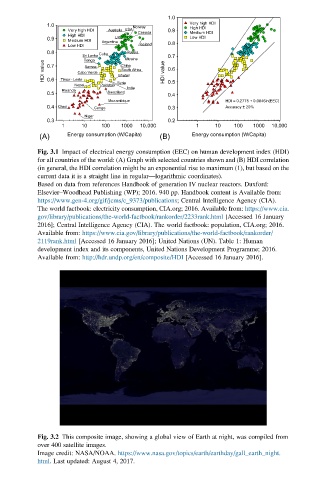
Fig. 3.1 Impact of electrical energy consumption (EEC) on human development index (HDI)
for all countries of the world: (A) Graph with selected countries shown and (B) HDI correlation
(in general, the HDI correlation might be an exponential rise to maximum (1), but based on the
current data it is a straight line in regular—logarithmic coordinates).
Based on data from references Handbook of generation IV nuclear reactors. Duxford:
Elsevier–Woodhead Publishing (WP); 2016. 940 pp. Handbook content is Available from:
https://www.gen-4.org/gif/jcms/c_9373/publications; Central Intelligence Agency (CIA).
The world factbook: electricity consumption, CIA.org; 2016. Available from: https://www.cia.
gov/library/publications/the-world-factbook/rankorder/2233rank.html [Accessed 16 January
2016]; Central Intelligence Agency (CIA). The world factbook: population, CIA.org; 2016.
Available from: https://www.cia.gov/library/publications/the-world-factbook/rankorder/
2119rank.html [Accessed 16 January 2016]; United Nations (UN). Table 1: Human
development index and its components, United Nations Development Programme; 2016.
Available from: http://hdr.undp.org/en/composite/HDI [Accessed 16 January 2016].
Fig. 3.2 This composite image, showing a global view of Earth at night, was compiled from
over 400 satellite images.
Image credit: NASA/NOAA. https://www.nasa.gov/topics/earth/earthday/gall_earth_night.
html. Last updated: August 4, 2017.